Dec 12
preview
At TOGGLE, we’re always trying to give investors insights into markets.
For a while now we’ve been experimenting and researching ways to take the thousands of insights generated daily and aggregate them into something that could give insight into markets as a whole.
Our research has culminated in what we’re calling the TOGGLE Leading Indicator (TLI) - now accessible directly in the TOGGLE platform.
We wish it were a full crystal ball🔮 - but we think it’s pretty close.

Wait… what is the TOGGLE Leading Indicator?
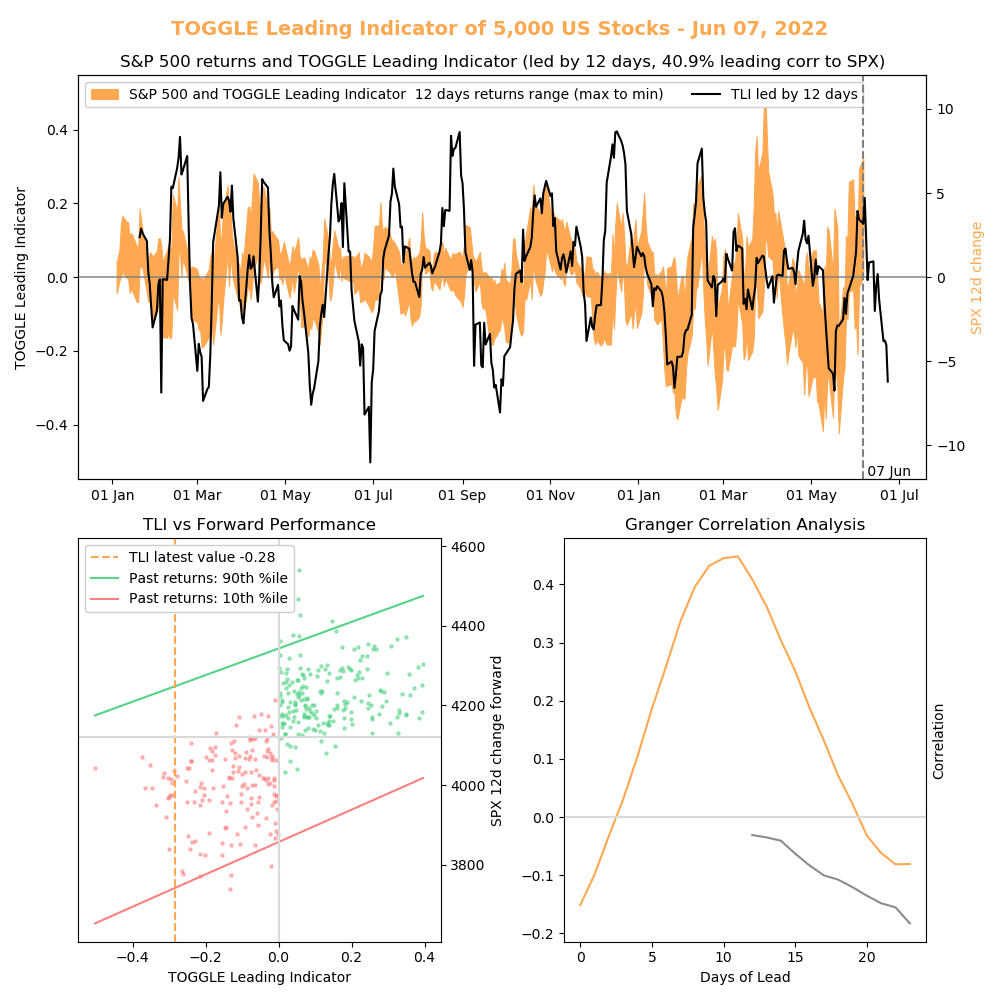
The TOGGLE Leading Indicator aggregates insights across all stocks in the USA (5,000 or so) in order to help investors understand prevailing market sentiment → are things likely to go up…or down, from here.
When the indicator breaks above the top line (green), it typically signals an inflection point for the S&P 500 → it’s likely to go up from that point forward.
As it breaks below the bottom line (red), it signals the opposite → the S&P 500 is likely to go down.
That sounds amazing… does it work??
The TLI has had a strong track record since its start in early 2021.
Our research has shown that it leads the S&P 500 by 12 days, with a 50% forward-looking correlation.
For more information on the TLI, watch the video below or read more here.
The TOGGLE Leading Indicator is live!


Up Next
Dec 12
preview