
Dec 12
preview

I suspect many portfolio managers and analysts have been through that moment: favorite high conviction stock sells off 10-15% on a bad earnings announcement. Is this an opportunity to add? Is there a way to assess your timing beyond relying on instincts?
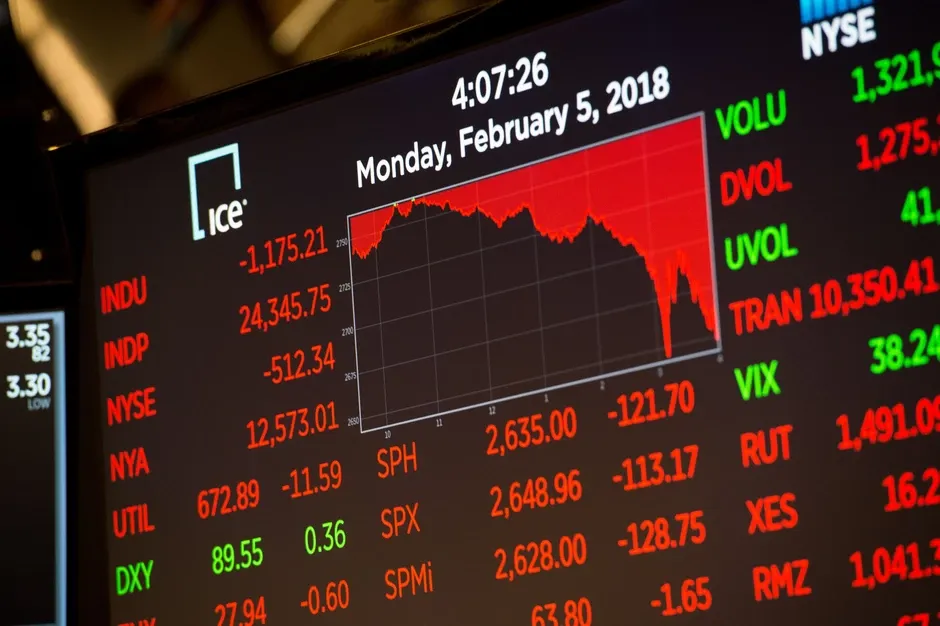
credit: Bloomberg
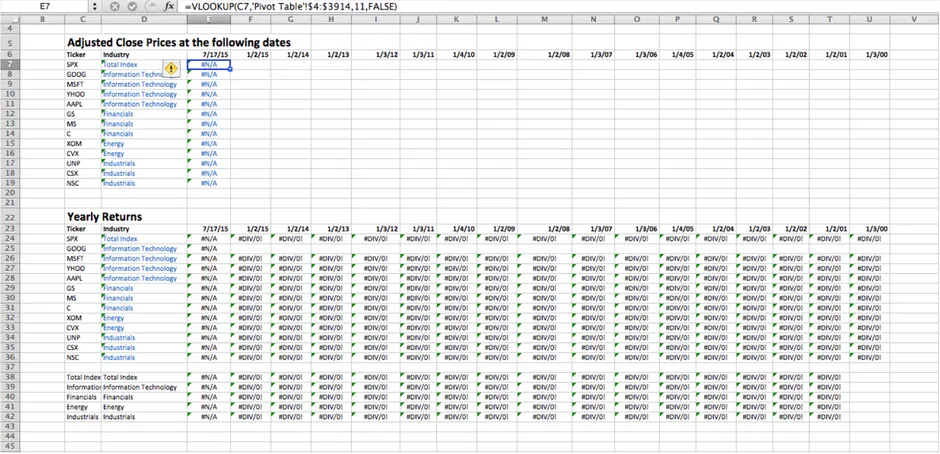
One approach is to download the time series data from Bloomberg or Refinitiv and manually highlight past announcement dates. After setting up a table with the relevant post-announcement time windows, VLOOKUP function can help copy the corresponding prices into the table. Alternatively, we can load the columns with prices and dates into a Python script via .csv file import and run a variety of functions from the statsmodels library. The trouble is, both of these approaches are time consuming and in a fast-moving market, investors may instead fall back on their experience in making the decision.
credit: TOGGLE
However, that may prove to be costly. There are well-documented patterns in financial time series analysis that, if ignored, can result in diminished returns. One such phenomenon is Post-Earnings Announcement Drift (PEAD), the tendency of a stock to drift in the direction of the surprise for weeks after the announcement. The post-announcement drift length and magnitude may vary with each stock and only diligent data analysis can provide clues as to the optimal timing of adding to or disposing of the position.
In a situation described above, TOGGLE can save investors considerable time and effort in testing their instincts against the data. The built-in COMPASS tool enables the user to instantly asses the likelihood of a bounce on the basis of historical analogs. All that’s required is to highlight the relevant sell-off on the time series chart and COMPASS does the rest. It scans the entire history of the time series and identifies similar sell-offs.
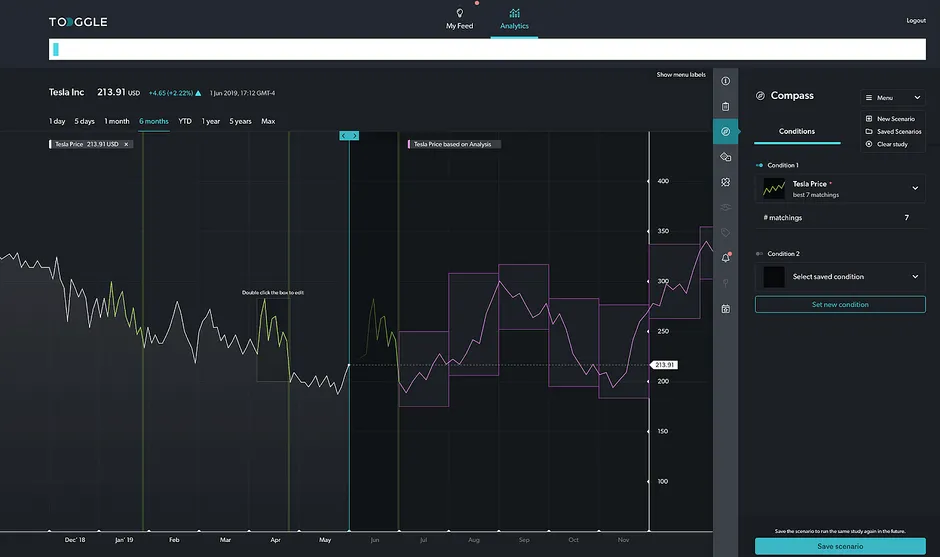
credit: TOGGLE
Market Price Correction: Buy or Bye?


Up Next
Dec 12
preview