Dec 12
preview
Advanced Micro Devices, Inc. (AMD) is a multinational semiconductor company based in California, known for developing computer processing units (aka chips). On Thursday, AMD received clearance from Chinese regulators for their $35 billion acquisition of fellow chipmaker Xilinx Inc. This move comes as both chipmakers work towards penetrating the market for data center chips, which is currently run by Intel Corp. This also allows AMD to expand its customer base into China (and vice versa for Xilinx). For a stock that has historically beaten earnings, with earnings around the corner (Feb 1st 2022), what could we see happening to the stock?
TL;DR
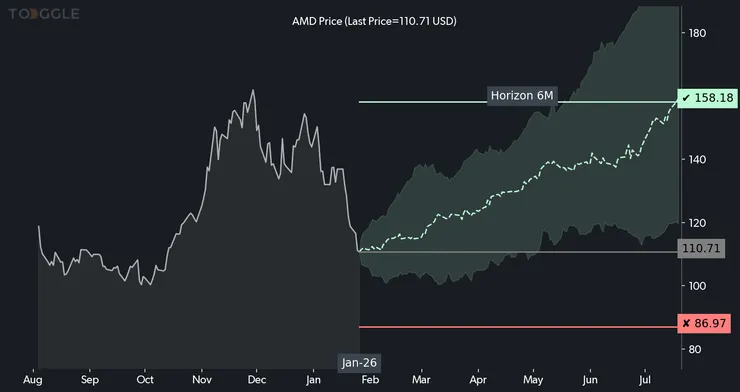
Recently, on January 26th, TOGGLE published an insight about $AMD, showing that realized volatility increased to 68.37. Based on AMD’s historic performance, TOGGLE’s AI identified that this may lead to a median increase of 43% over the following 6M, as shown in the chart below. This insight got a 7 out of our 8-star rating system (more on that later)
How did TOGGLE come up with this?
TOGGLE uses the power of machine learning and artificial intelligence to analyze data and turn it into easy-to-read insights that you can use to help your decision-making. For this particular insight, TOGGLE's AI analyzed 8 similar occasions in the past to help identify this insight's median projection and confidence band.
The dotted line you see is the expected path, which is based on similar instances in the past. The shaded area represents a confidence band, and AMD's price typically stays within those boundaries if the asset performs like it did in the past. The flat, solid green line indicates where TOGGLE expects the asset to reach. Last but not least, the flat red line is a possible stop-loss level, the point at which $AMD has deviated too far from the expected path and you should reevaluate your position.
How reliable are these insights?
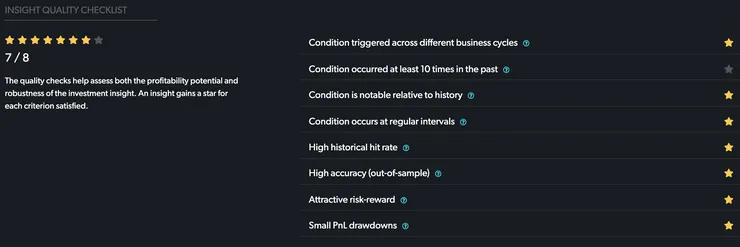
Well, that's up for you to decide. TOGGLE uses an 8-star rating system, which evaluates the same stats that institutional investors like to look at when managing money professionally. We ask questions that determine if these conditions have happened before, how accurate they've been, and how frequent they've occurred, and more. This insight received a 7 out of 8 on our star rating system (as seen below), and this encompasses the robustness of the relationship between the driver and subsequent price action.
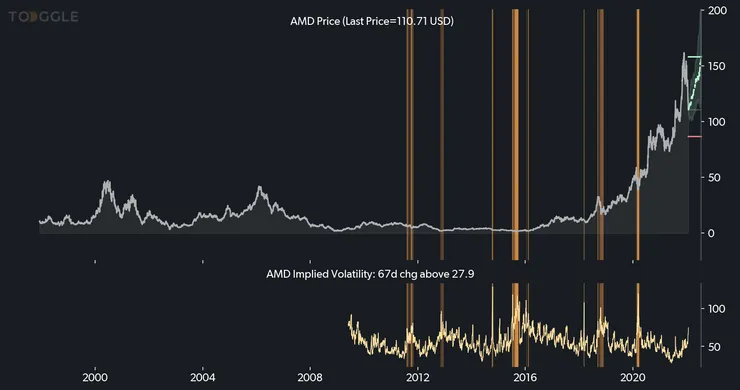
While crunching the numbers, TOGGLE also studied AMD’s volatility indicators and detected a consistent relationship between the driver and AMD’s subsequent asset movement. The chart below highlights the times in the past when the driver (specifically AMD’s implied volatility) was at a similar level as right now. For this insight, TOGGLE’s AI identified 8 different times, or “episodes,” when a similar set-up has happened in the past. Of those episodes, TOGGLE found that 85% of those resulted in an upward move over a 6M horizon, which helped form this insight.
So, how do I use this info?
Ultimately, what sets TOGGLE apart is that when it comes to investing, we won’t tell you what to do, but we’ll be here to give you the fullest picture to help you trade with confidence. We recommend reading the full insight here to get the complete picture, and better guide your decision-making.
TOGGLE Insight: AMD:NASD - Advanced Micro Devices


Up Next
Dec 12
preview