Dec 12
preview
Not only is TOGGLE backtesting micro and macro indicators of more than 34,000 assets globally, but our AI system is also looking at things like competitive analyses. How has an asset historically reacted after a highly correlated asset has seen movement in its indicators? Let’s take a look at TOGGLE’s observed price relationship between Morgan Stanley, the multinational financial services company, and Credit Suisse, a global investment bank and financial services firm.
TL;DR
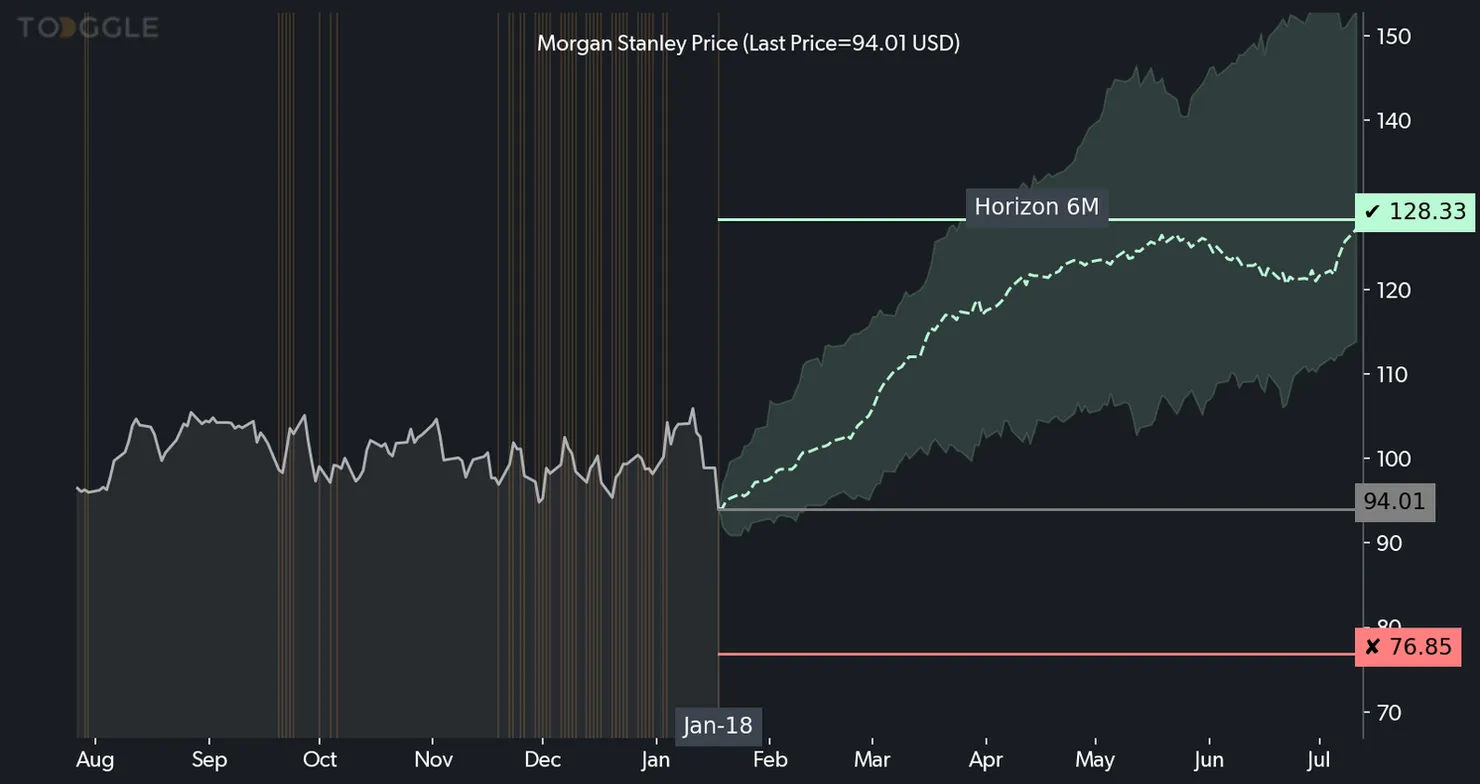
Recently, on January 18th, TOGGLE published an insight about $MS, showing that price level indicators for Credit Suisse are close to a recent low. Based on Morgan Stanley’s historic performance, TOGGLE’s AI identified that whenever this has happened in the past, this may lead to a median increase of 37% over the following 6M, as shown in the chart below. This insight got a 6 out of our 8-star rating system (more on that later)
How did TOGGLE come up with this?
TOGGLE uses the power of machine learning and artificial intelligence to analyze data and turn it into easy-to-read insights that you can use to help your decision-making. For this particular insight, TOGGLE's AI analyzed 6 similar occasions in the past to help identify this insight's median projection and confidence band.
The dotted line you see is the expected path, which is based on similar instances in the past. The shaded area represents a confidence band, and Morgan Stanley's price typically stays within those boundaries if the asset performs like it did in the past. The flat, solid green line indicates where TOGGLE expects the asset to reach. Last but not least, the flat red line is a possible stop-loss level, the point at which $MS has deviated too far from the expected path and you should reevaluate your position.
How reliable are these insights?
Well, that's up for you to decide. TOGGLE uses an 8-star rating system, which evaluates the same stats that institutional investors like to look at when managing money professionally. We ask questions that determine if these conditions have happened before, how accurate they've been, and how frequent they've occurred, and more. This insight received a 6 out of 8 on our star rating system (as seen below), and this encompasses the robustness of the relationship between the driver and subsequent price action.
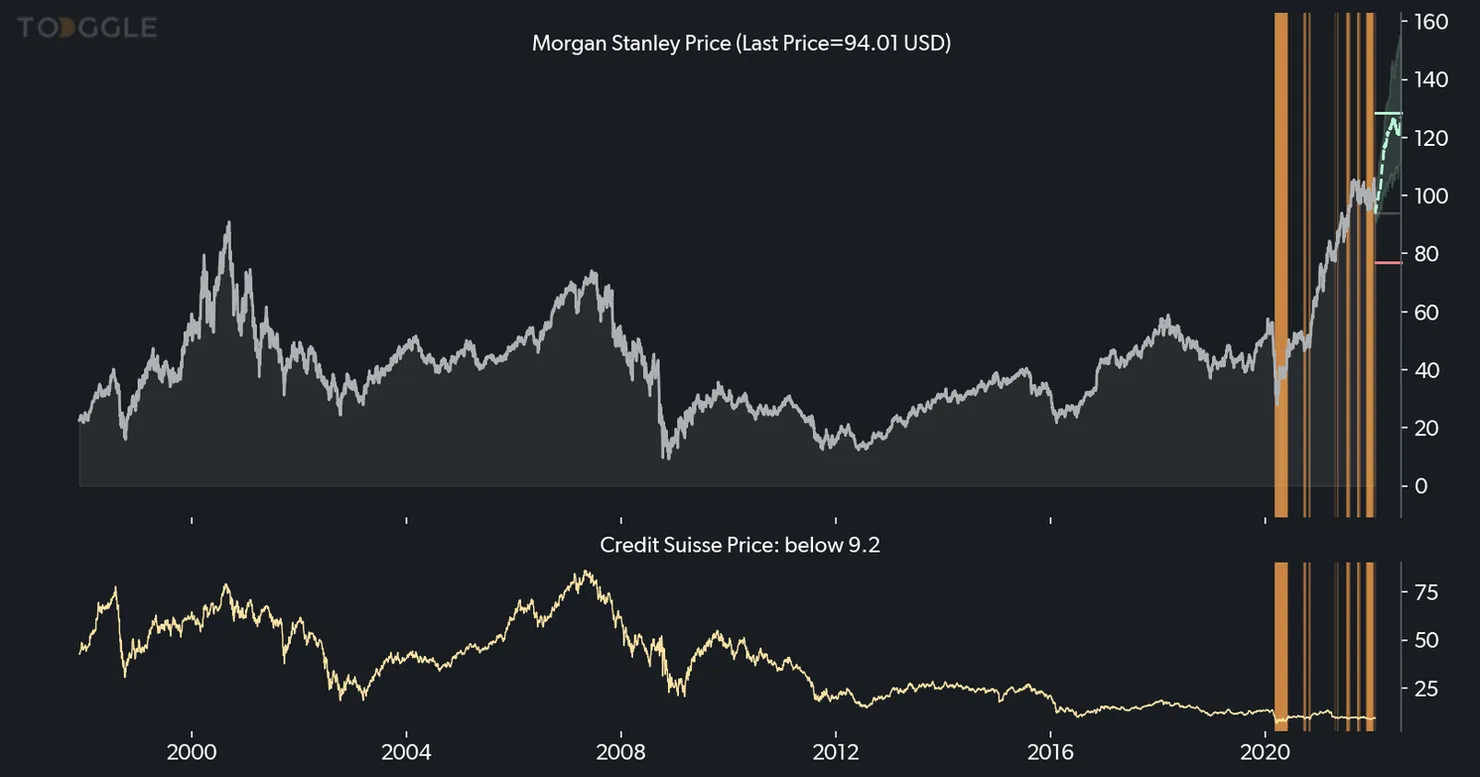
While crunching the numbers, TOGGLE also studied specific price levels of Credit Suisse and detected a consistent relationship between the driver and Morgan Stanley’s subsequent asset movement. The chart below highlights the times in the past when the drivers (specifically Credit Suisse’s price) were at a similar level as right now. For this insight, TOGGLE’s AI identified 6 different times, or “episodes,” when a similar set-up has happened in the past. Of those episodes, TOGGLE found that 90.91% of those resulted in an upward move over a 6M horizon, which helped form this insight. (Note: this hit rate was calculated against a small sample [6 distinct episodes], hence resulting in such a high hit rate)
So, how do I use this info?
Ultimately, what sets TOGGLE apart is that when it comes to investing, we won’t tell you what to do, but we’ll be here to give you the fullest picture to help you trade with confidence. We recommend reading the full insight here to get the complete picture, and better guide your decision-making.
Want access to more insights and info like backtests, fundamentals, historical occurrences? We got you. Find all of that on toggle.ai. TOGGLE Copilot subscriptions start at $9.99 a month, but you can get your first month free, no credit card required.
TOGGLE Insight: MS:NYSE - Morgan Stanley


Up Next
Dec 12
preview