Toggle AI is now Reflexivity! Toggle users can sign in to Reflexivity with their Toggle credentials. Contact support with any questions.
ReflexivityData that finally speaks your language
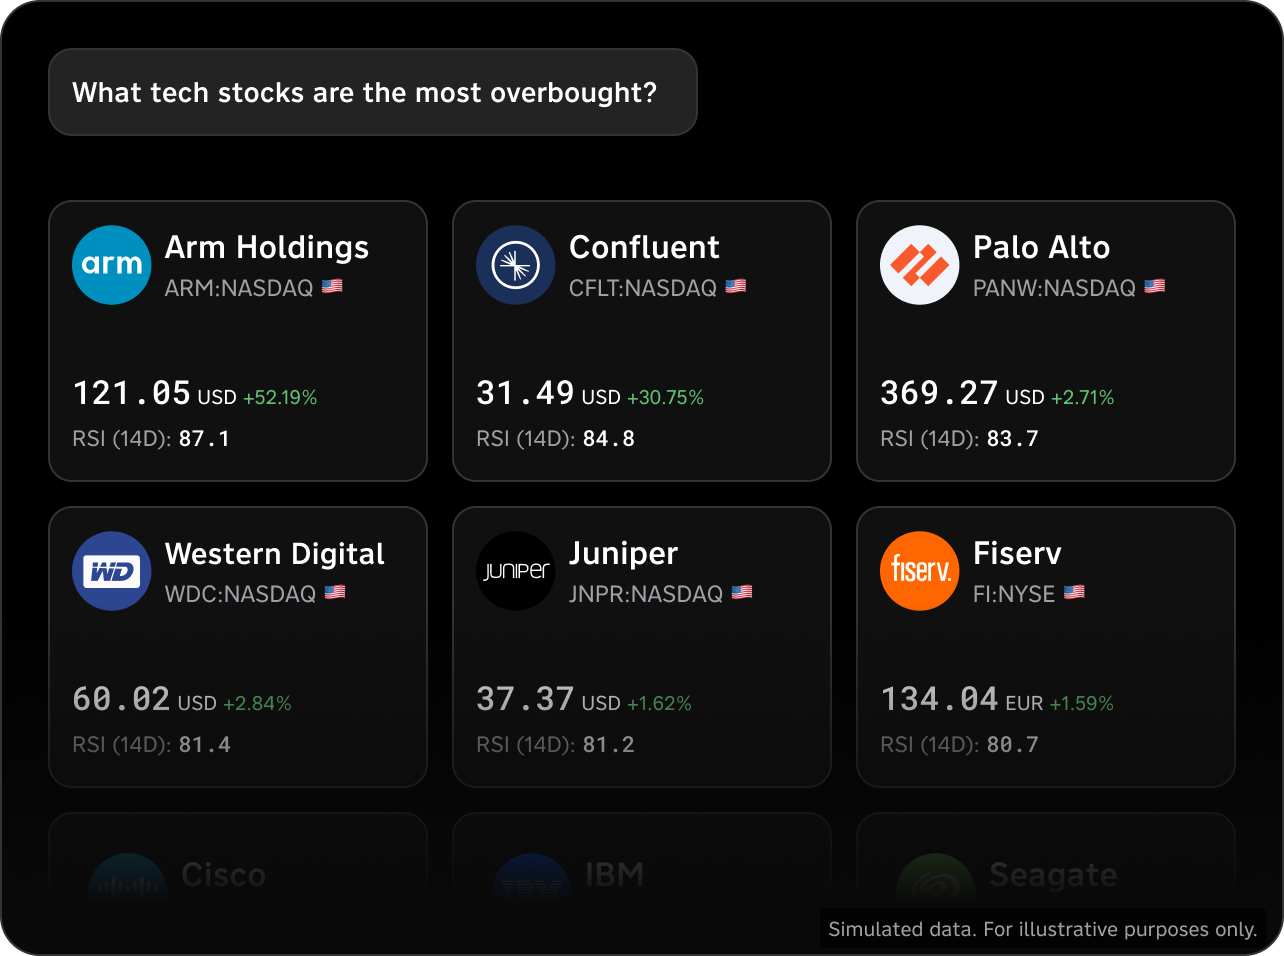
Simply ask questions in natural language and institutional-grade analytic tools come alive
Simulated data. For illustrative purposes only.
In the press


Bring data to life with natural language
Reflexivity offers a suite of award-winning analytic tools wrapped in an accessible, natural language-based UX, ensuring that your strategic decisions are backed by robust data analytics.
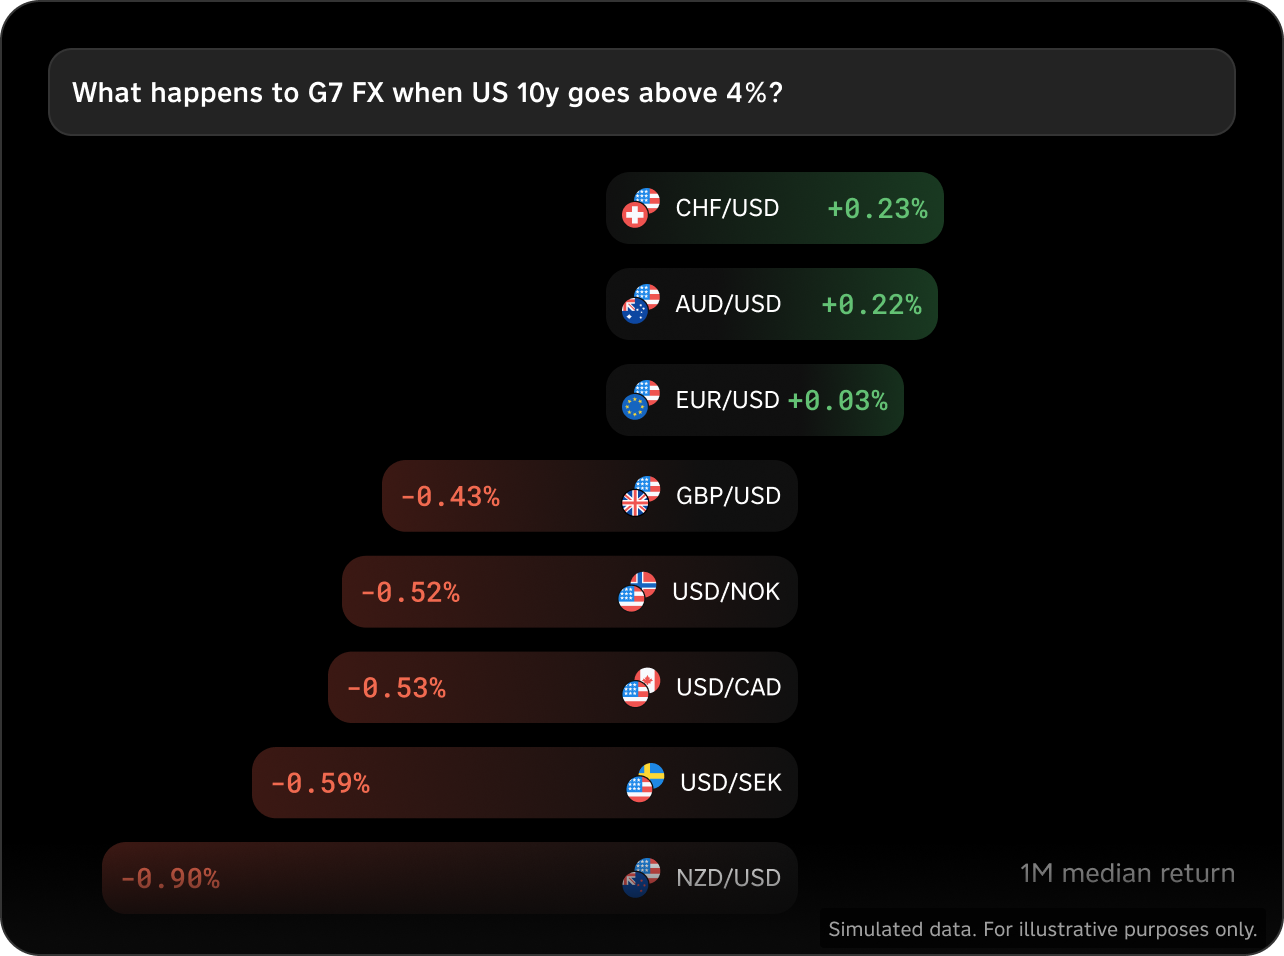
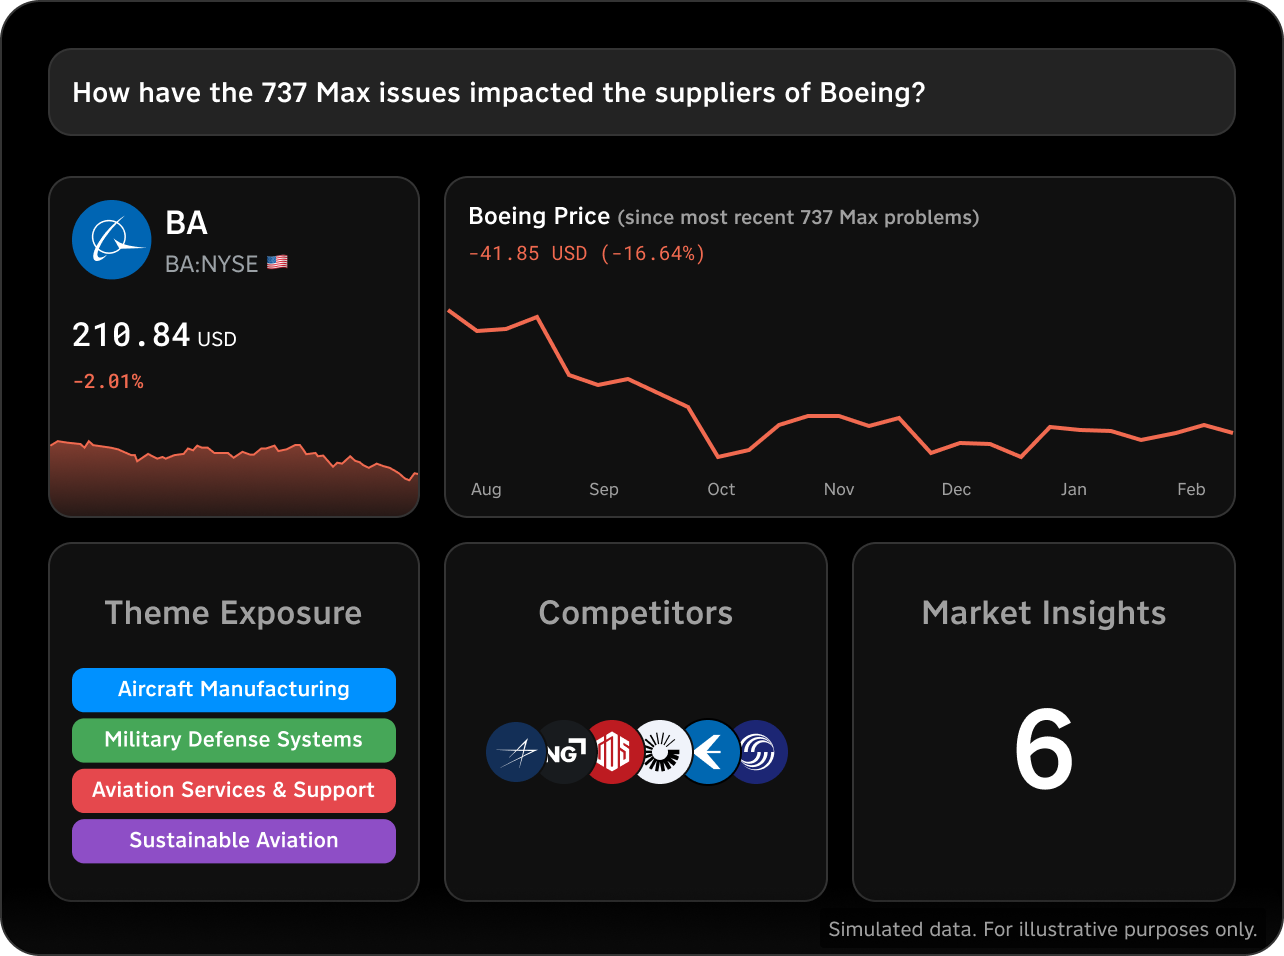
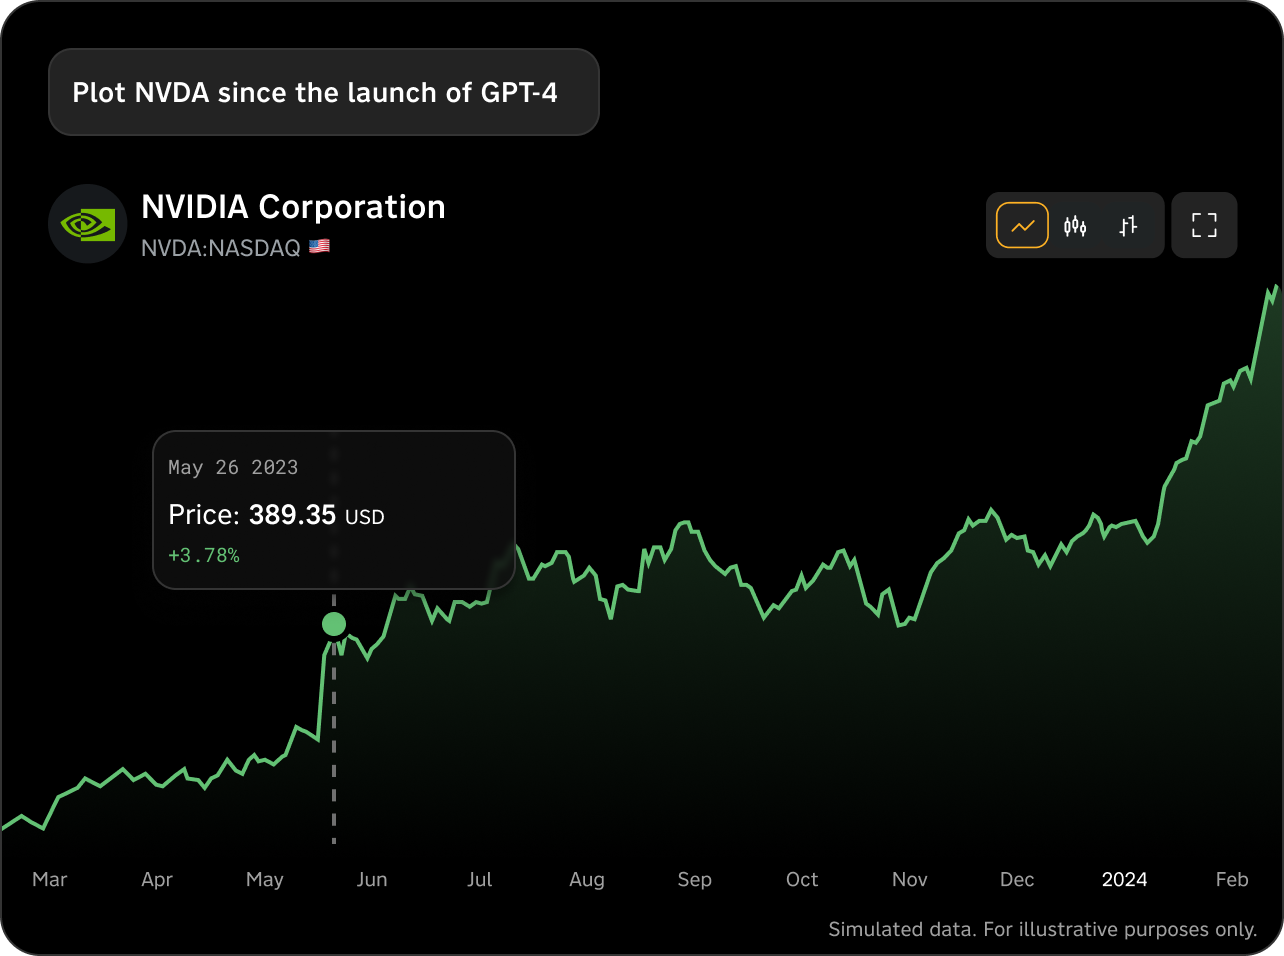
Reflexivity offers a personal laboratory, where you can put all your hypotheses to the test using natural, simple language. You can test 40,000 assets or even ask questions about groups of assets – without ever having to code or open a spreadsheet. Simply ask a question and put Reflexivity to work.
We help you connect the data – so that you can share the story
Our tech

Analytical Engines
Reflexivity provides an institutional-grade, data-backed edge for our users. Instantly test market hypotheses, screen every securities, and explore hidden relationships between organizations.

Knowledge Graph
This powerful map of information powers the entire Reflexivity experience. Discover exposures, suppliers, geographies, and connections that other investors and portfolio managers might overlook.

LLM-Powered Interface
Reflexivity is built around language models, giving investors a seamless, intuitive user experience where they ask questions in plain language and receive immediate, data-backed answers.
Partner with Reflexivity
We offer a variety of customized AI solutions and integrations for select institutional investors. If you're interested in integrating Reflexivity's technology into your platform, please contact our team at partnerships@reflexivity.com
Asset Management and Capital Markets
Reflexivity offers a variety of solutions for the asset management space, including API access, bulk licensing agreements, as well as custom integrations. Reflexivity’s global asset coverage and comprehensive knowledge graph act as productivity multipliers for analysts and PMs.
Wealth Management and Brokerages
Give your advisors and clients access to actionable AI-derived insights across thousands of assets and all their portfolios. With Reflexivity’s proprietary, multi-modal search capabilities, you can instantly access answers from research, fact sheets, and more.
Our Partners


Built by investors, for investors
Backed by industry powerhouses like Stanley Druckenmiller and Thomas Peterffy, Reflexivity is led by a fearless team that combines deep industry knowledge, academic brilliance, and proven track records in some of the world's most competitive markets

Giuseppe Sette
President
President Giuseppe Sette has an established background in equity and global macro investments. Most recently, he was co-CIO of Global Macro at Lombard Odier, also spending time at Brevan Howard and Davidson Kempner. He ranked top of his consultant class in Bain Italy, holds an MBA from Wharton and an MS from La Sapienza University.

Jan Szilagyi
Chief Executive Officer
CEO Jan Szilagyi hails from asset management and algorithmic trading, and has an academic background in quant finance. Szilagyi spent most of his career at Duquesne Capital, was co-CIO of Global Macro at Lombard Odier, and also managed portfolios at Fortress. He holds the record for fastest Harvard Economics PhD, studying under Ken Rogoff.

Armenak Mayalian
Chief Technology Officer
Chief Technology Officer Armenak Mayalian has an established history of engineering and scaling fintech products. Armenak has co-founded five startups, most recently acting as the CTO of Sharepay (acquired by Linxo). He has more than 20 years of tech and strategy experience, and holds a Master of Arts in Strategy from ESCP Europe.

RJ Assaly
Chief Product Officer
Chief Product Officer RJ Assaly holds a patent for a natural language search interface. Most recently he was Product Lead at Kensho Technologies (acquired by S&P Global), working to externalize cutting-edge machine learning tools built for internal use. He started his career managing discretionary absolute return portfolios at AllianceBernstein.


You don't need to be a data scientist to harness the power of AI
With Reflexivity, Generative AI is just a question away. Unlock your potential and redefine what's possible today.
Contact Sales