TOGGLE Insights vs Trading Signals
A question frequently asked by users is “are TOGGLE insights trading signals and if not, why?”
Toggle AI is now Reflexivity! Click here to go to our new website
A natural question that comes to mind as you peruse TOGGLE insights is - does this really work? And if so, why would they give it to me? A past-its-prime hedge fund industry still seems like a great gig.
The key thing about TOGGLE Insights is that they are NOT buy and sell recommendations. TOGGLE helps you piece together a mosaic of relevant data points to make a maximally informed investment decision, much like investors already do with a mish-mash of tools. It can’t eliminate the uncertainty of outcomes, but it can give you a better sense of what they are, and their odds. Put differently, TOGGLE uses data to help you turn unknown unknowns into known unknowns.
Investors are bombarded by news and data from all sides. The issue every investor confronts is the ever-growing mountain of information that needs processing. And this is where machines can help: sifting tirelessly through billions of data points to complement the investor’s own efforts.
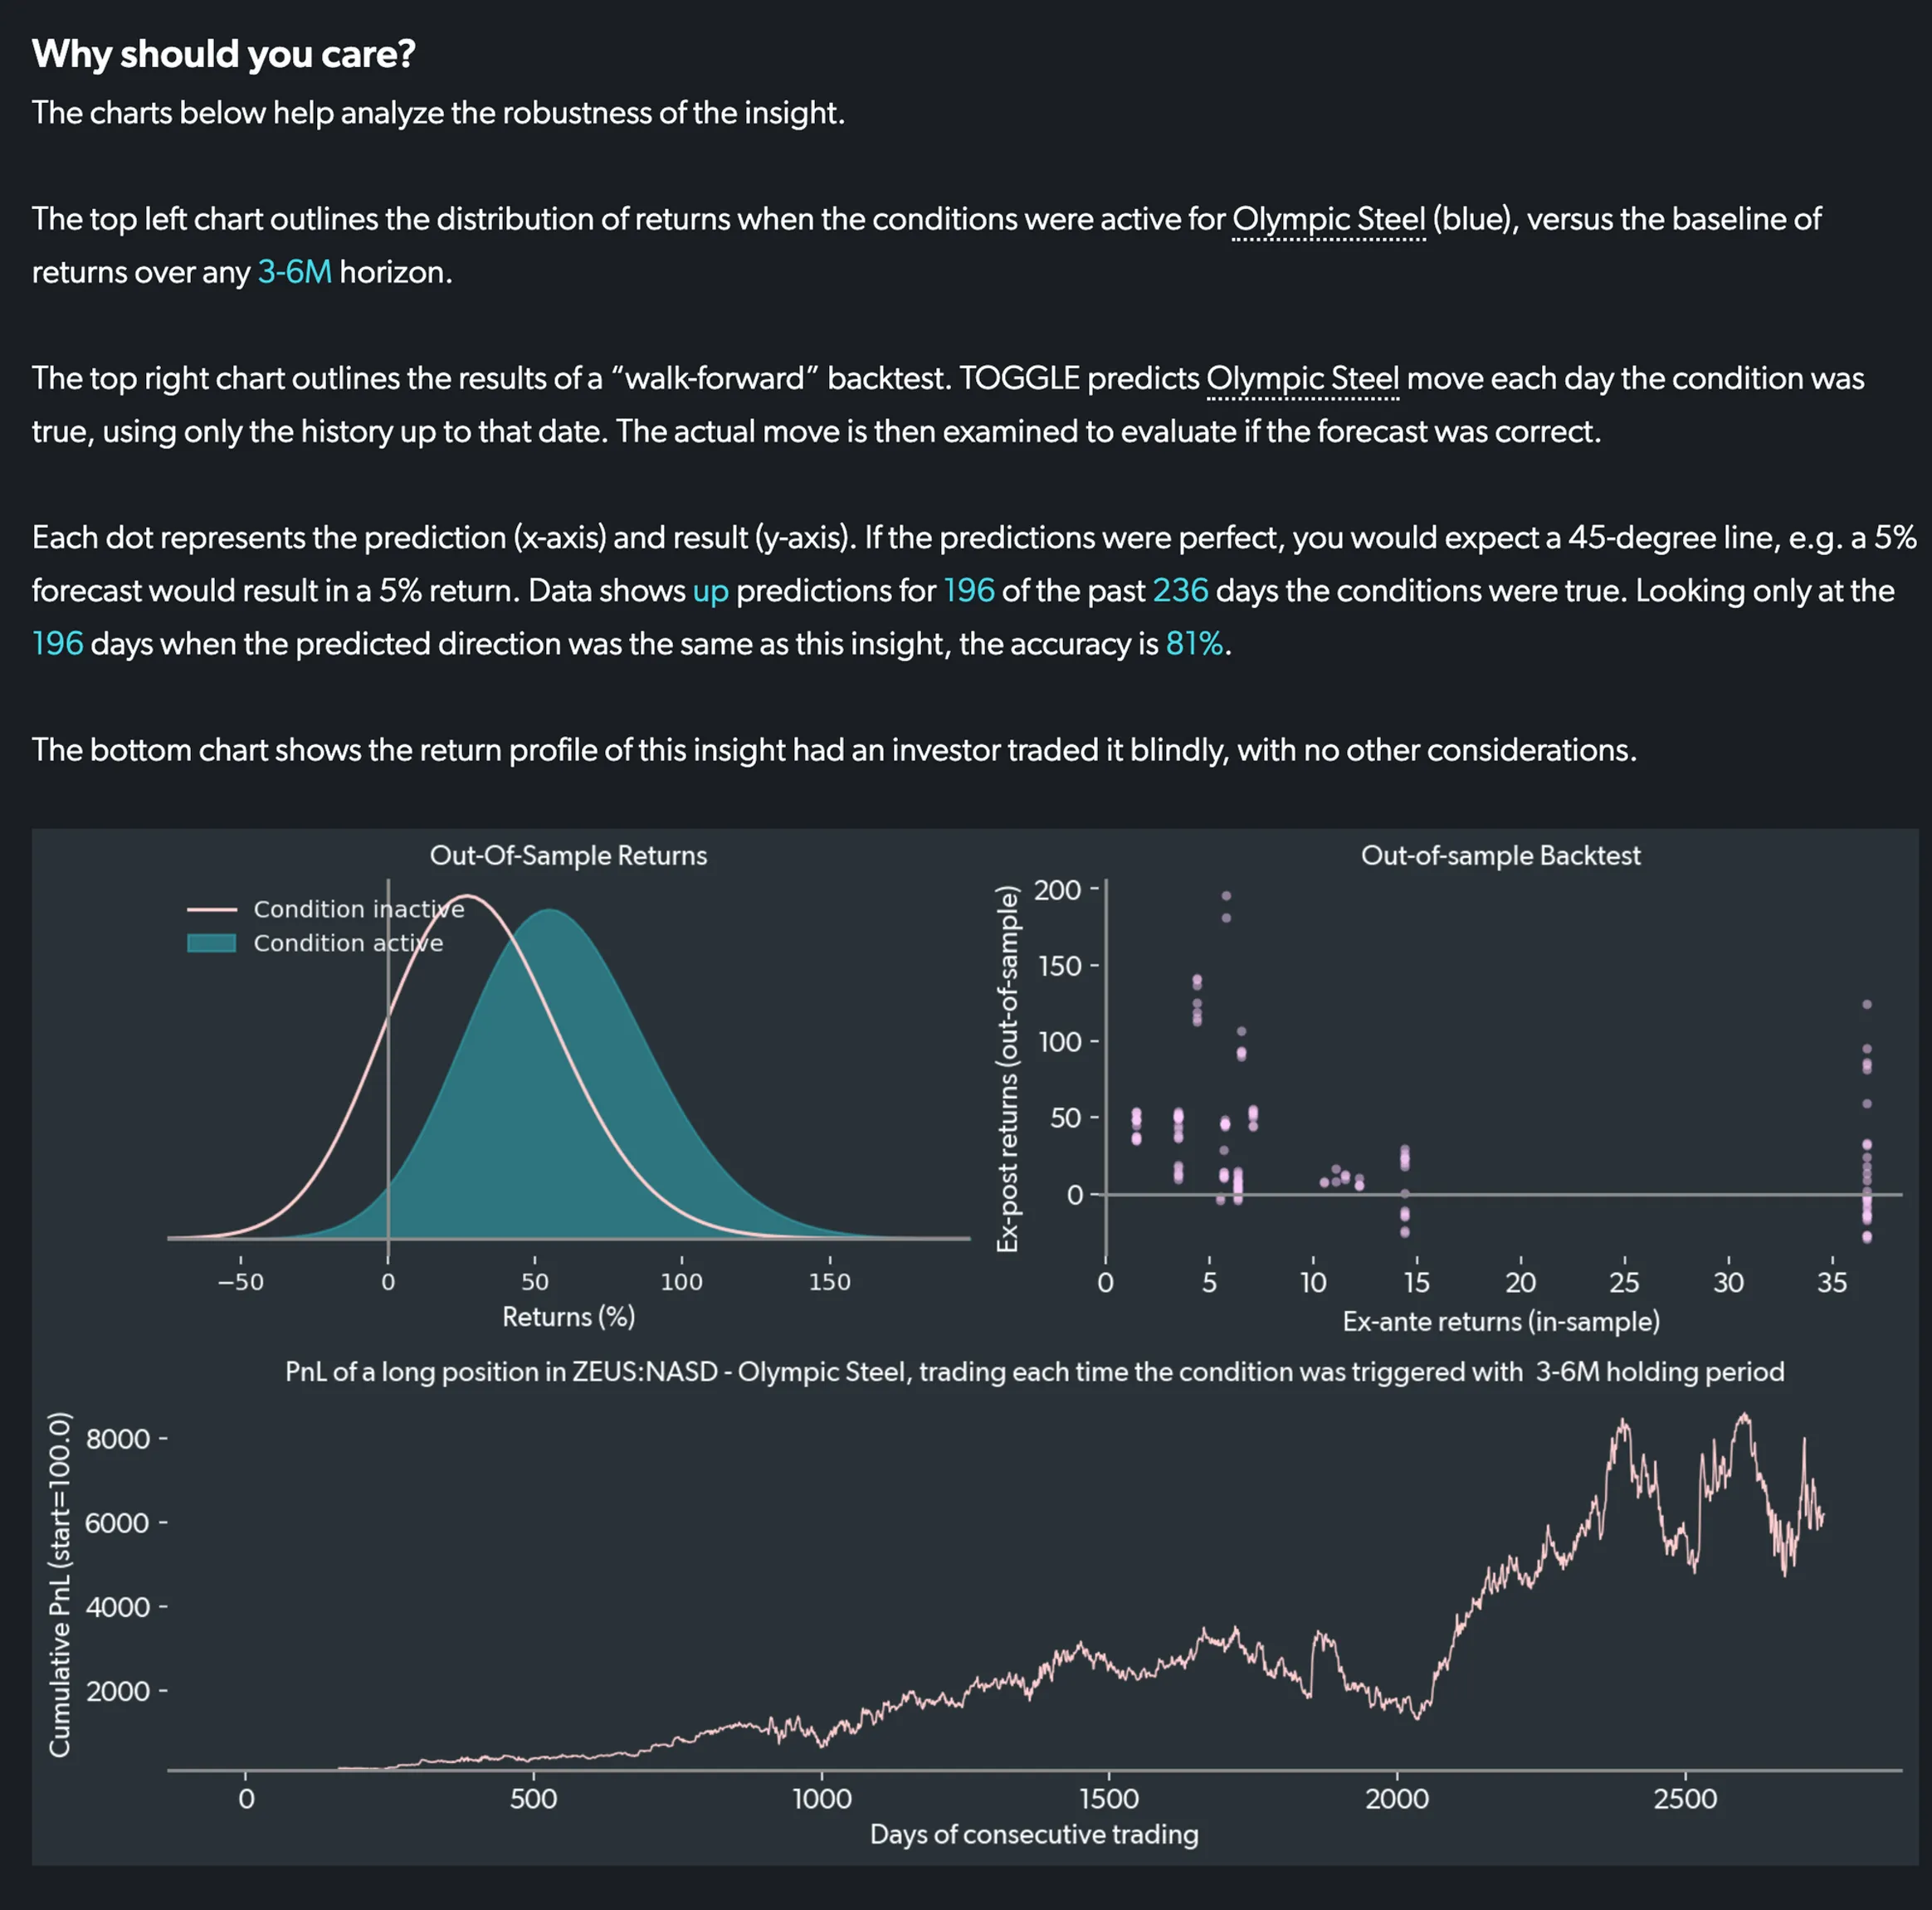
TOGGLE analysis always shows you the full range of possible outcomes, as informed by history. Each chart displays clearly marked confidence bands that help investors determine whether the observed price behavior conforms to expectations. The moment a price movement falls outside the norm may be the natural time to re-evaluate the thesis (and the position): do I still believe this investment thesis is working?
Insights are always thoroughly back-tested, and the results are displayed in each article. TOGGLE shows you exactly how many data points the relationship was tested on, and how well the relationship did in anticipating the direction of the asset’s move.
In addition to back-testing every Insight, TOGGLE enlisted the help of a third party to test the predictive power of Insights. Between March 3 and April 14 of 2020, when US stocks created a sharp V-shaped pattern, this third party tested a large number of Insights to assess their accuracy.
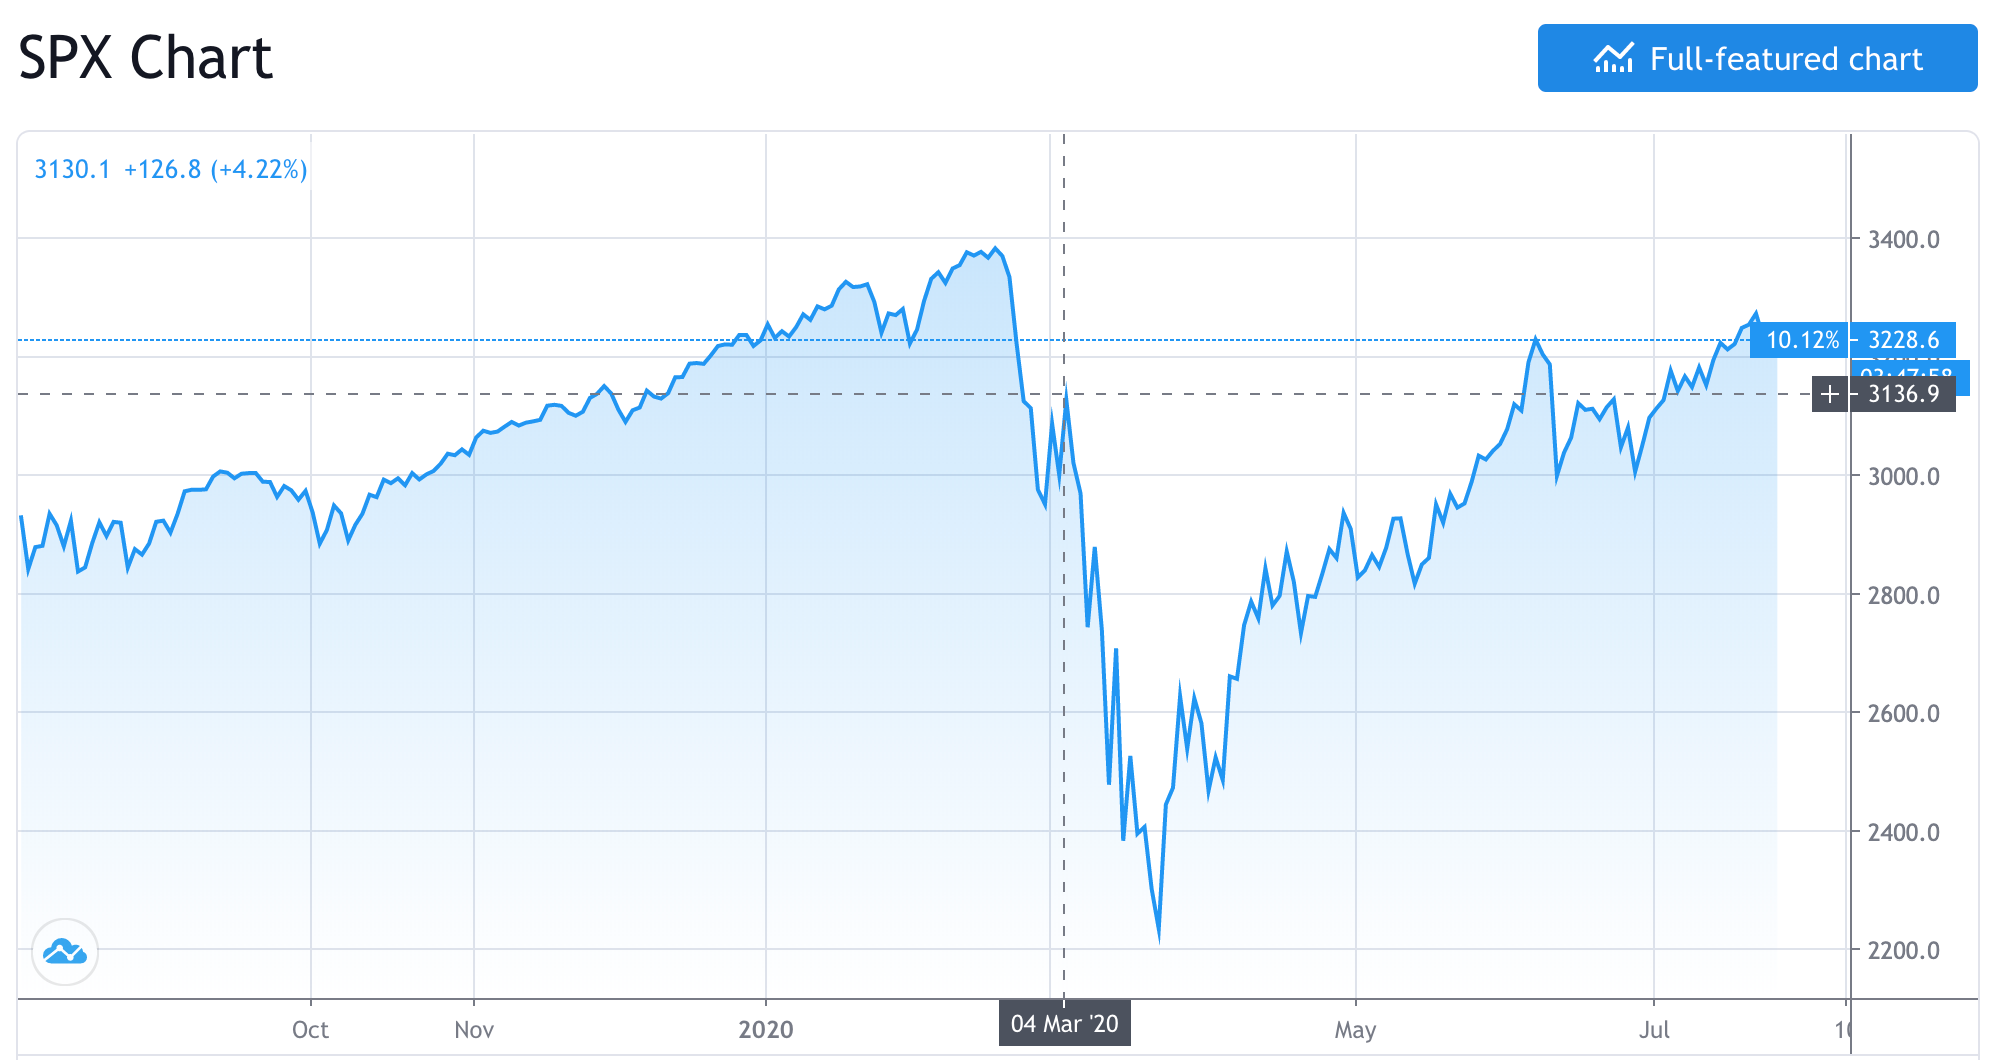
The asset universe tested were single stocks, primarily in the US. Overall, the results are extremely encouraging because they came during the most difficult point for tactical trading: a sharp move both down and up in the overall market.
They show that a) TOGGLE stock selection bias is very good and b) the range of past outcomes can serve as a great risk management tool.
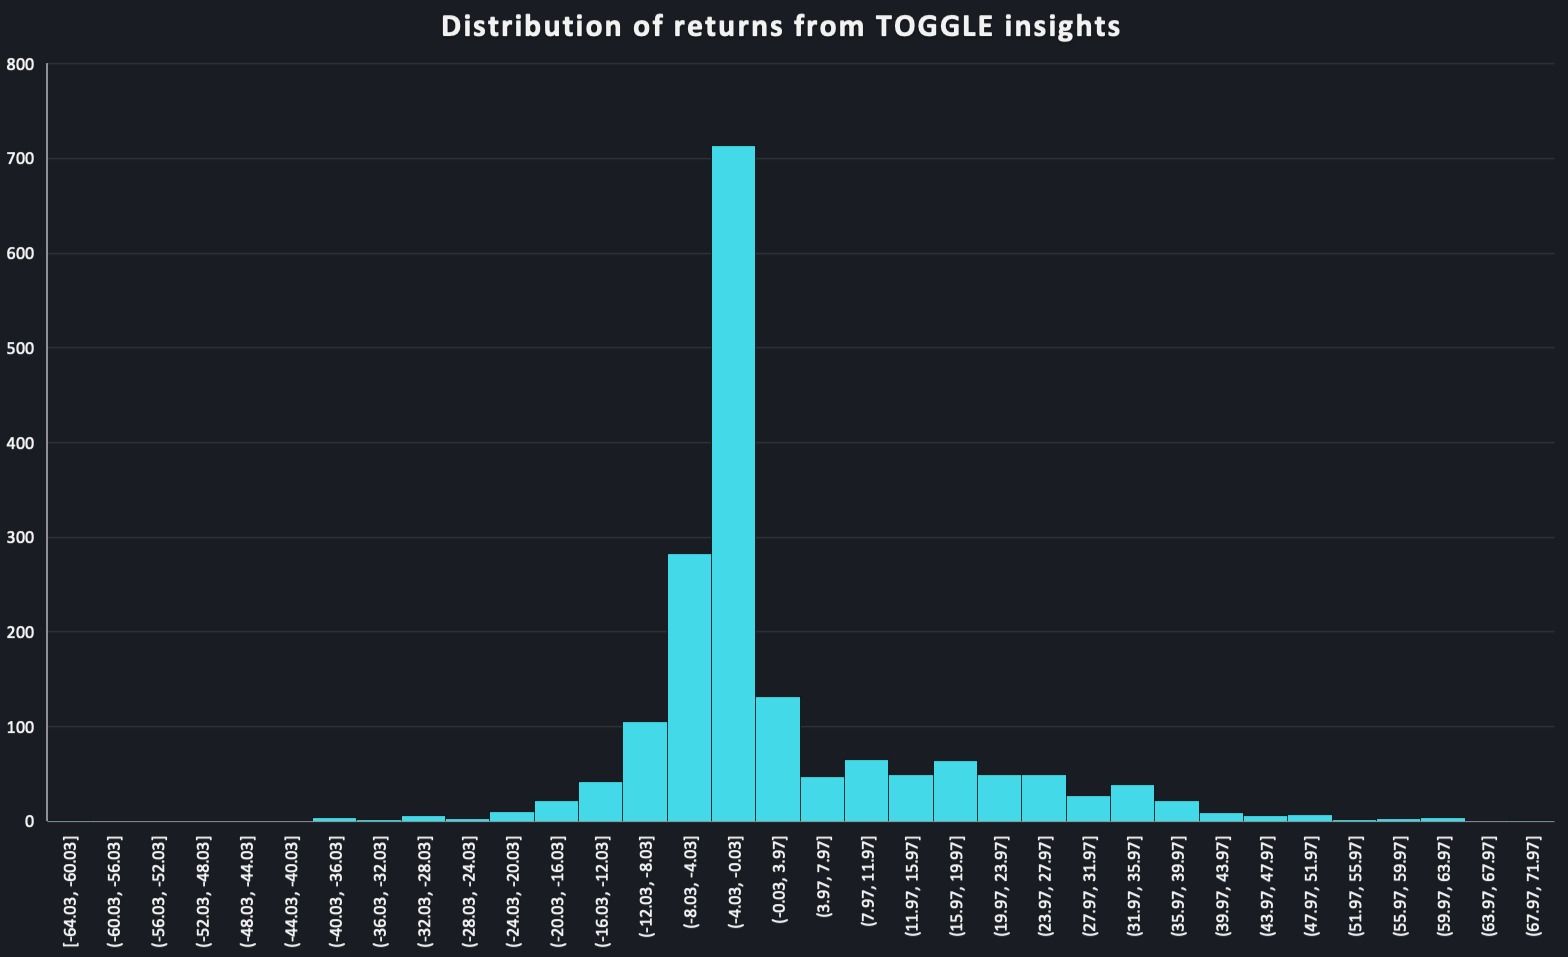
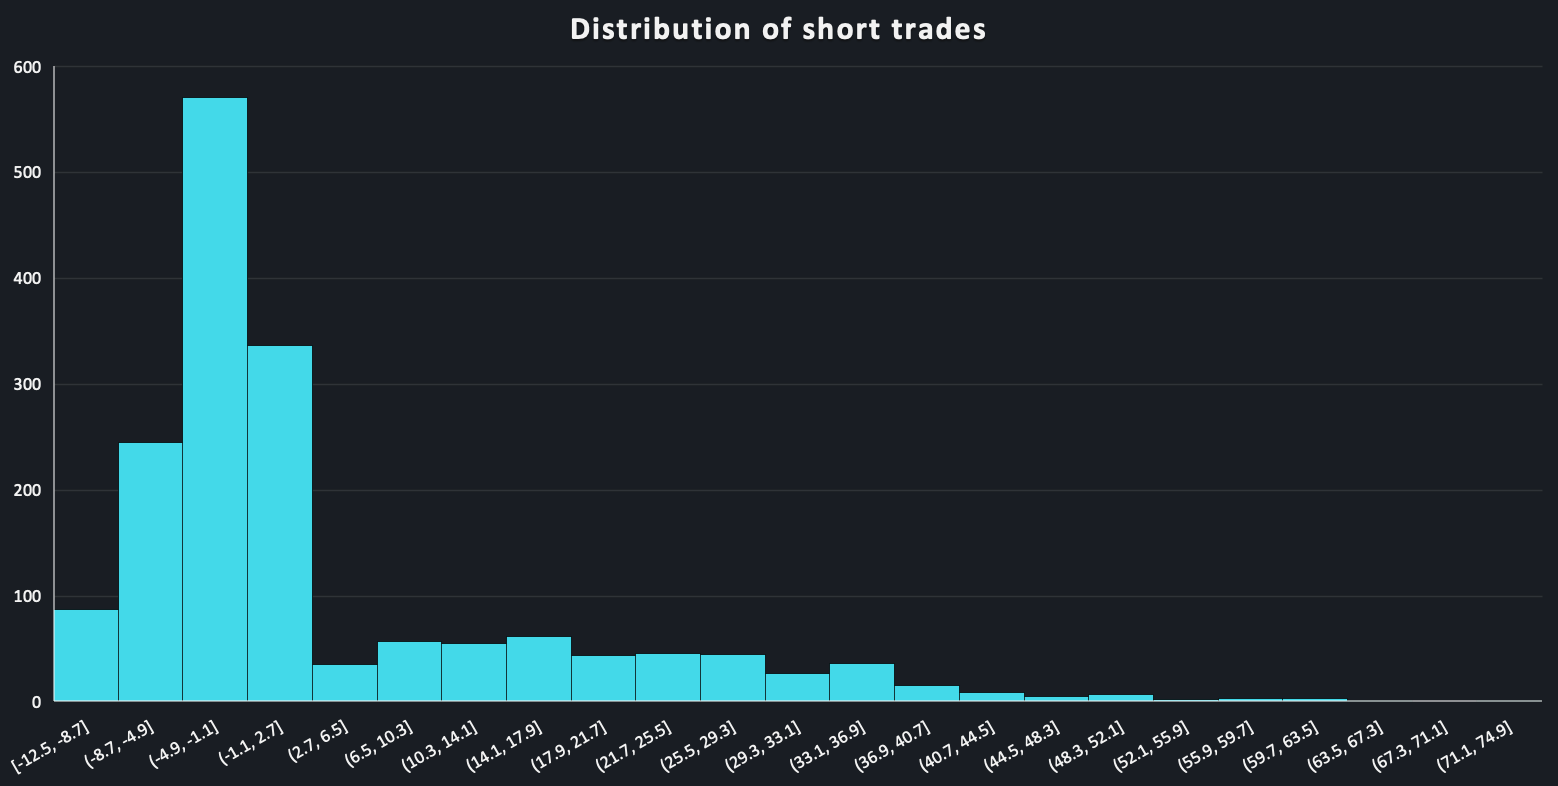
Across nearly 1,800 trades - the confidence intervals TOGGLE includes in its charts served as a guide for stop loss and take profit. That element of risk control created a very clear fat tail to the positive side: virtually no trade lost more than 16% during the period when the S&P 500 dropped 30%.
Moreover, looking at only the long positions, only a few lost anything comparable to the S&P 500 and many gained during that time.
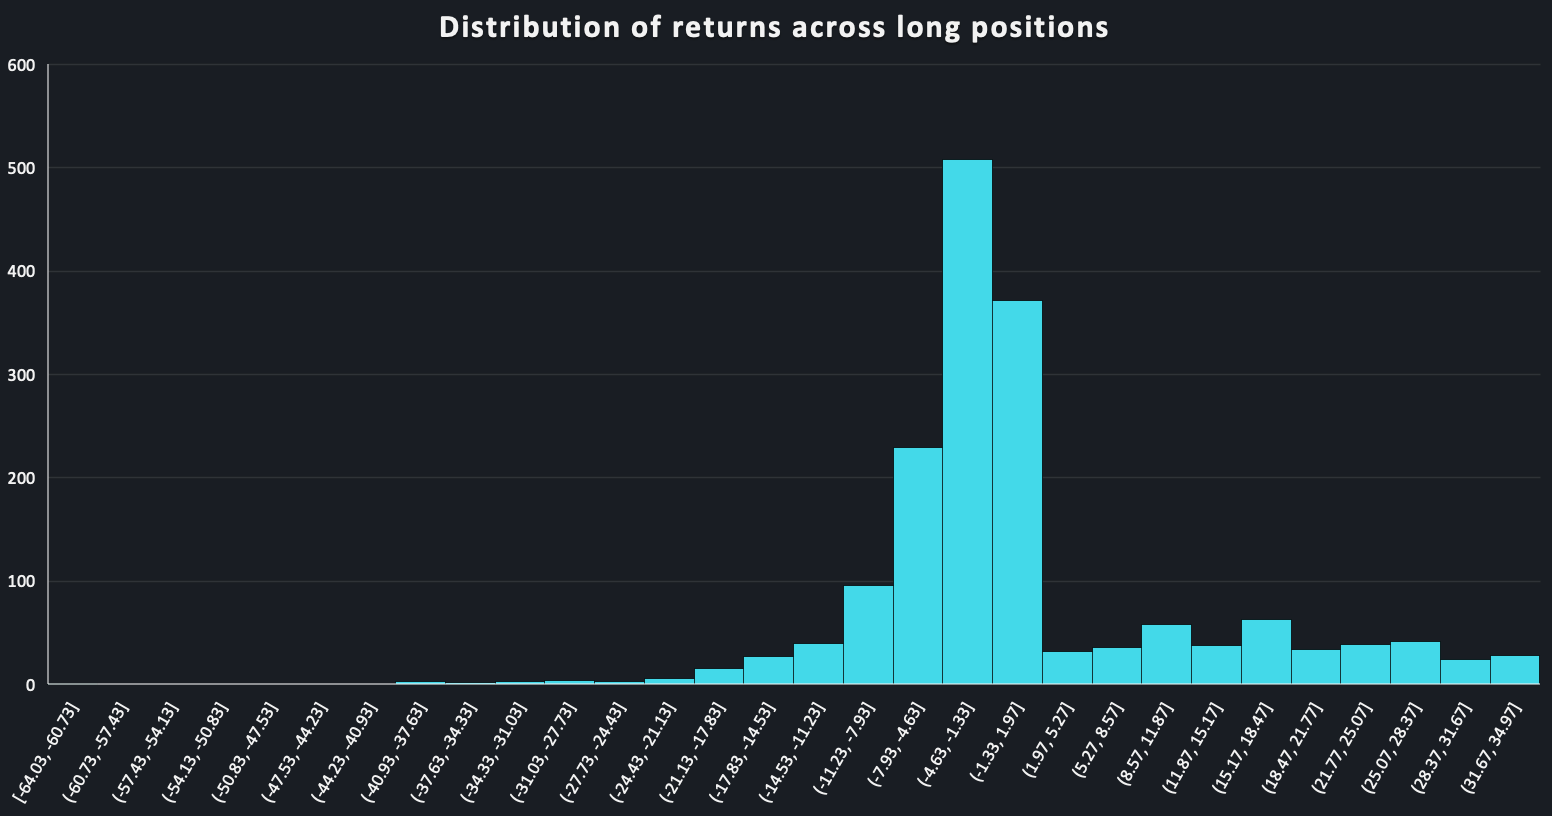
On balance, short positions did better. This isn’t surprising since the test started in the last third of the market drop, its most ferocious part. But long positions handily outperformed the overall index, confirming that the selection bias is good.
Furthermore, returns were further improved by using TOGGLE’s confidence intervals as a risk management tool. That meant trades that could have gone wrong were stopped out very early, and once the market turned trades were left to run a while.
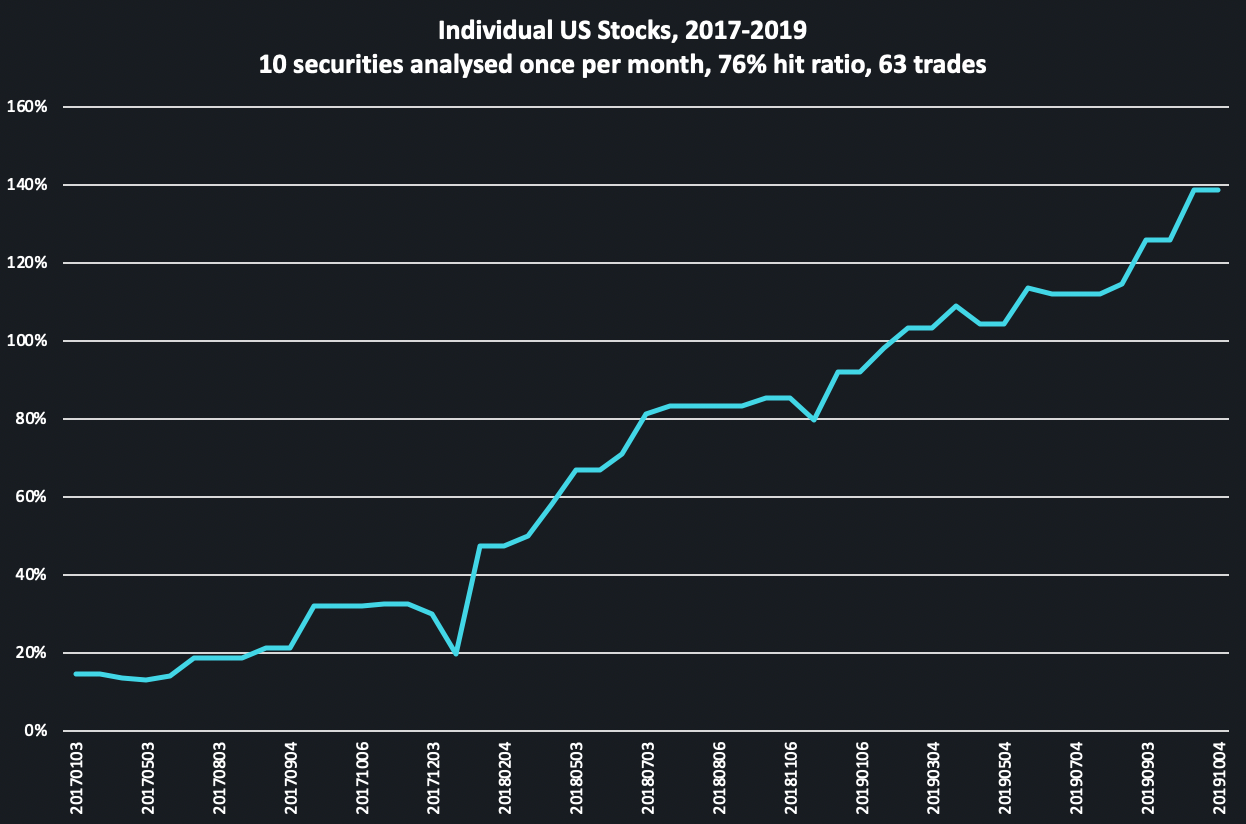
TOGGLE also conducted internal tests across single stocks and major currencies, picking two distinct periods to test them. First TOGGLE monitored insights on a number of blue chip US securities, following them monthly from 2017 to 2019. Across 63 trades, the hit ratio was 76%.
Afterward, TOGGLE conducted a much larger study over the 2010-2012 period, including major US and EU single names for a total of 936 trades. Yet again, the results were outstanding: a 58% hit rate across a broad range of securities and geographies over a period of 2 years.

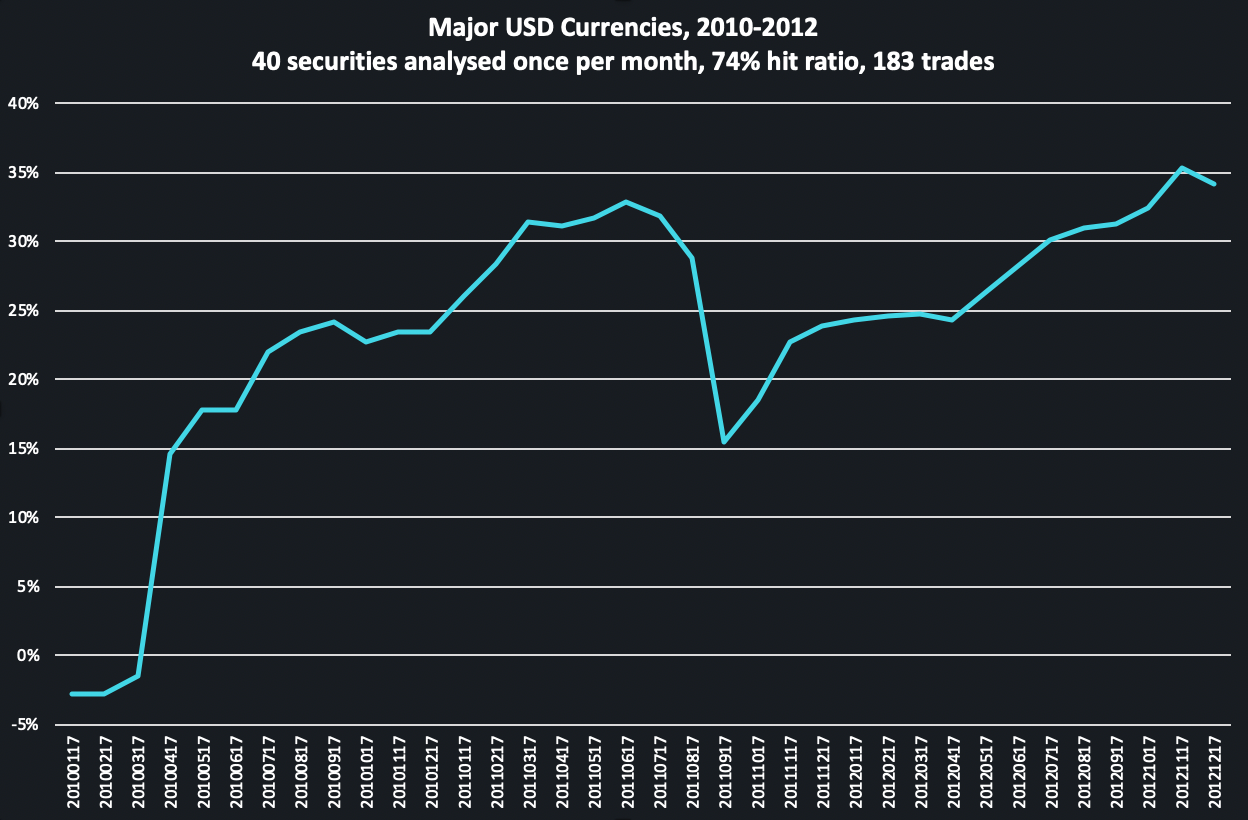
Repeating the test with major USD FX crosses, 40 in all, monitoring the outcome of 183 trades, the resulting hit ratio was very high: 74%.
In conclusion, TOGGLE proved its value during the most ferocious episode of recent US market history when seasoned investors often didn’t. It did so as a valuable complement, rather than a replacement, to investor judgement. Furthermore, even in larger numbers and across different periods, TOGGLE insights demonstrated remarkable robustness: the drivers TOGGLE highlighted anticipated the timing and direction, if not always the magnitude, of the subsequent price move.
Do TOGGLE Insights Really Work?


