Fixed Income Concepts
Here are some important concepts you should know before diving into fixed income investing.
Toggle AI is now Reflexivity! Click here to go to our new website
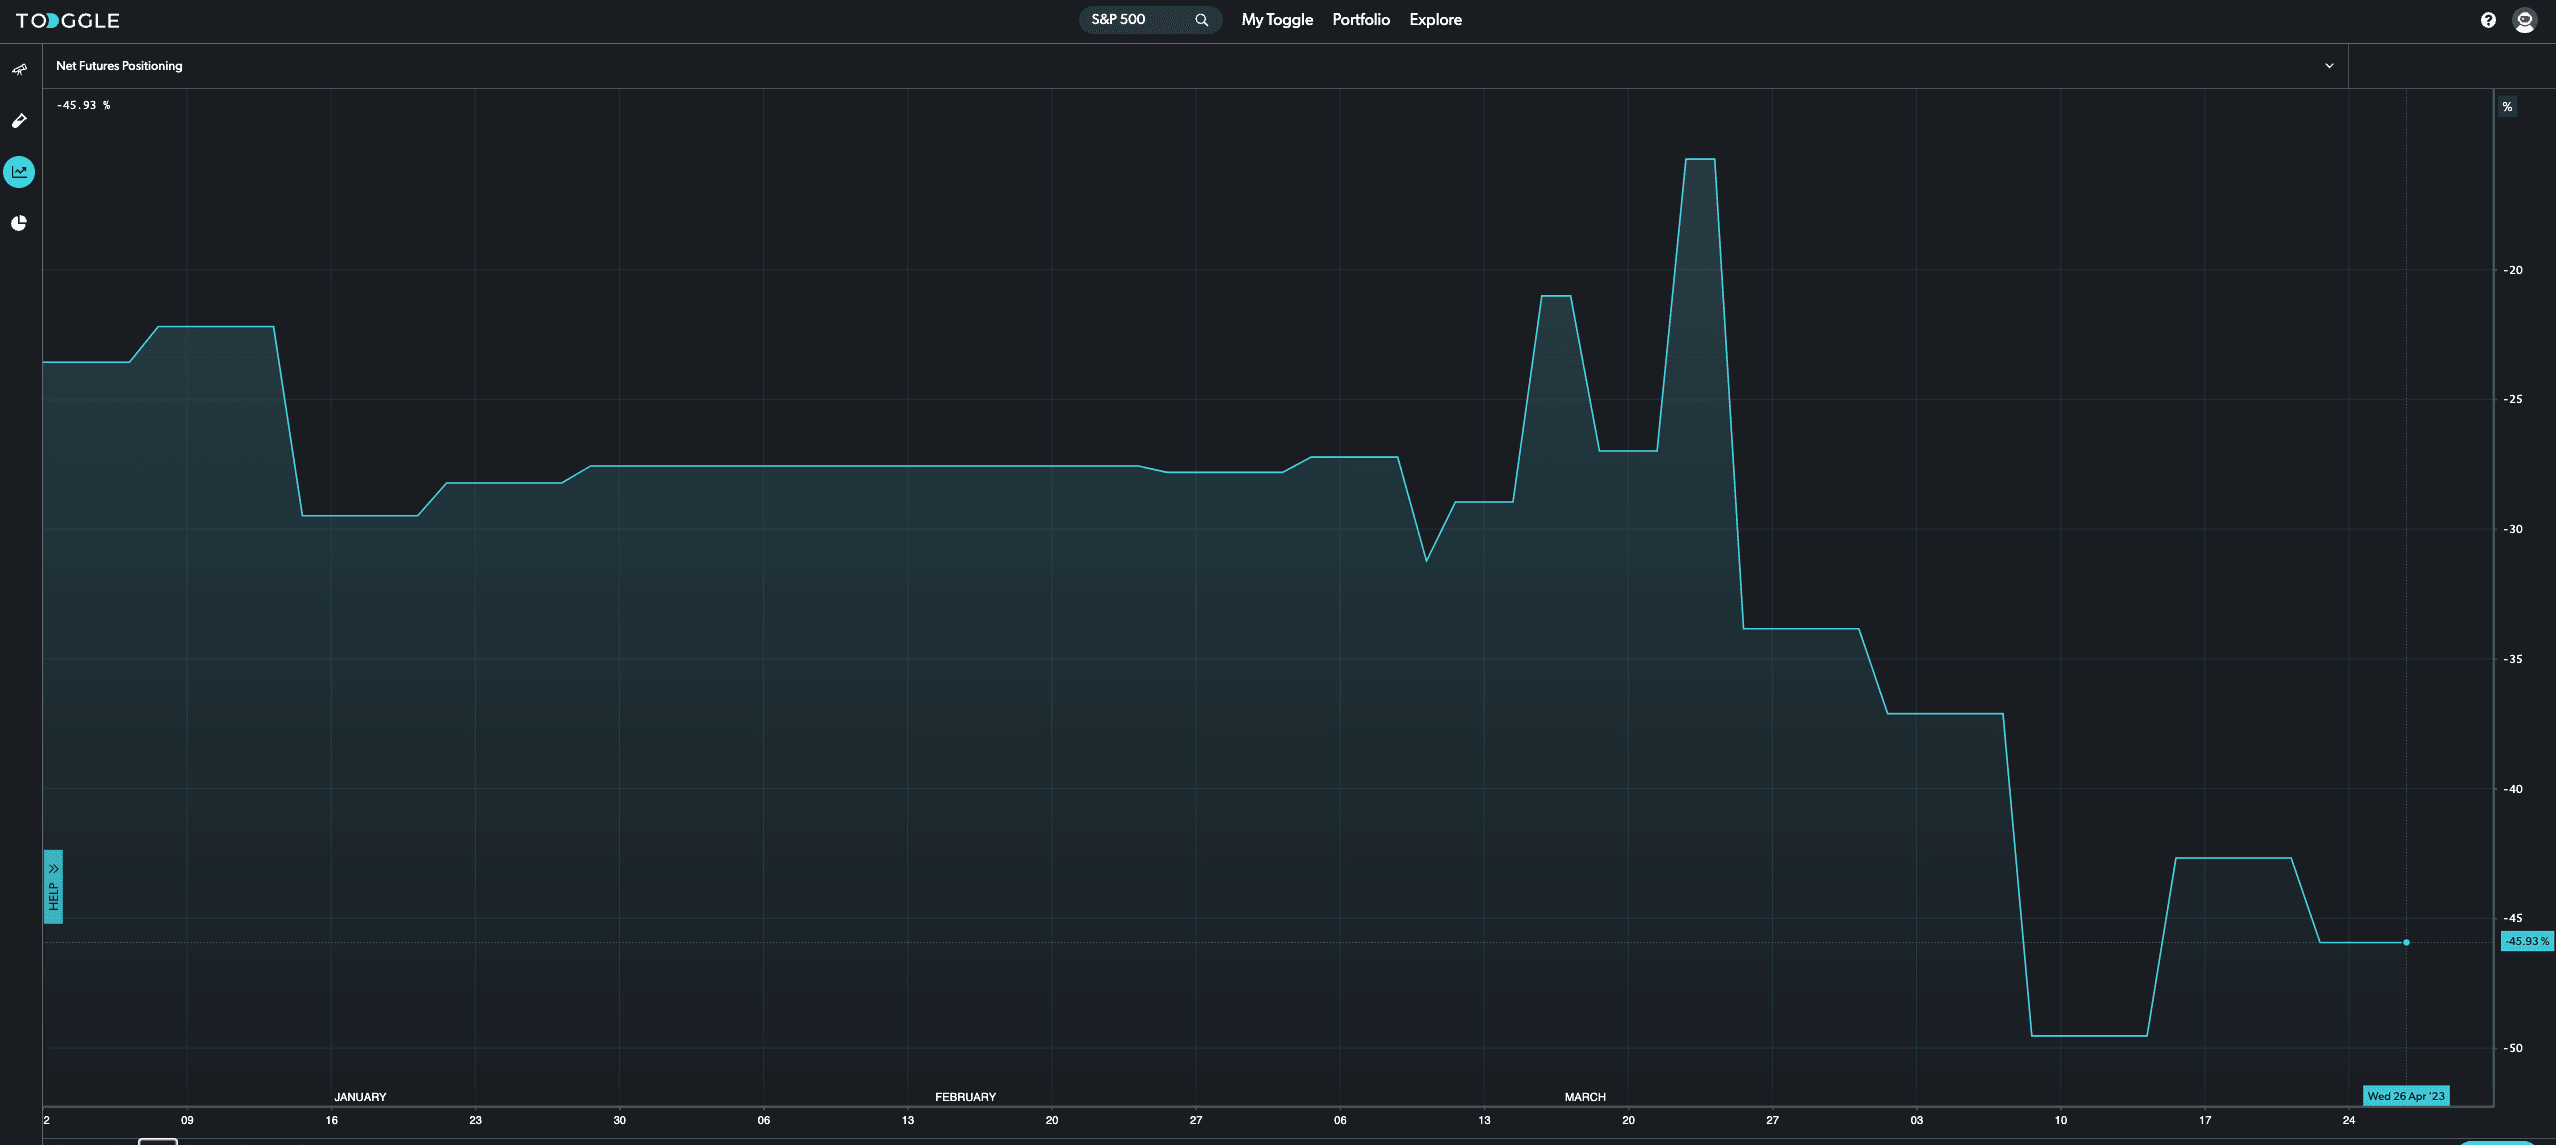
Another type of positioning analysis is Net Futures Positioning, which is the split between long and short positions in the futures market.
Traders with long positions expect future prices to rise, while short position holders believe asset prices will fall.
This data is available for the S&P 500 under the chart tool. Currently, the indicator sits at a value of -45.93%
The above value can be interpreted as the number of positive futures using the following formula: (x + 100%)/2
In this case, (-45.93 + 100/2) = 27% of total futures positions are positive and 73% (100% - 27%) are negative. This implies that a larger majority of the market is bearish on future price action in the S&P 500.
The indicator sits on a scale with values of +100 to -100, and the middle (0) shows a 50/50 split between the number of long and short positions.
Net Futures Positioning


