Realized Volatility
Volatility by its nature is a range-bound measure on the low side, it can never go below 0. This allows traders to distinguish regimes of low volatility.
Toggle AI is now Reflexivity! Click here to go to our new website
This indicator belongs broadly to the category of Technical Analysis Indicators, and is used to monitor extreme short-term rallies or drops in a simple way: it counts the number of consecutive days during which the stock moved in the same direction.
So if a stock rallied for three days the indicator will be set at 3, and conversely if a currency fell for six trading days in a row the indicator will be set at -6.
Like most oscillators, this is used mostly for 1d reversion plays: look at the S&P 500 example below, which shows that in the last 5 years SPX never managed to rally more than 5 days before falling. The implication is that, by monitoring these opportunities, one can play a reversion with a degree of confidence.
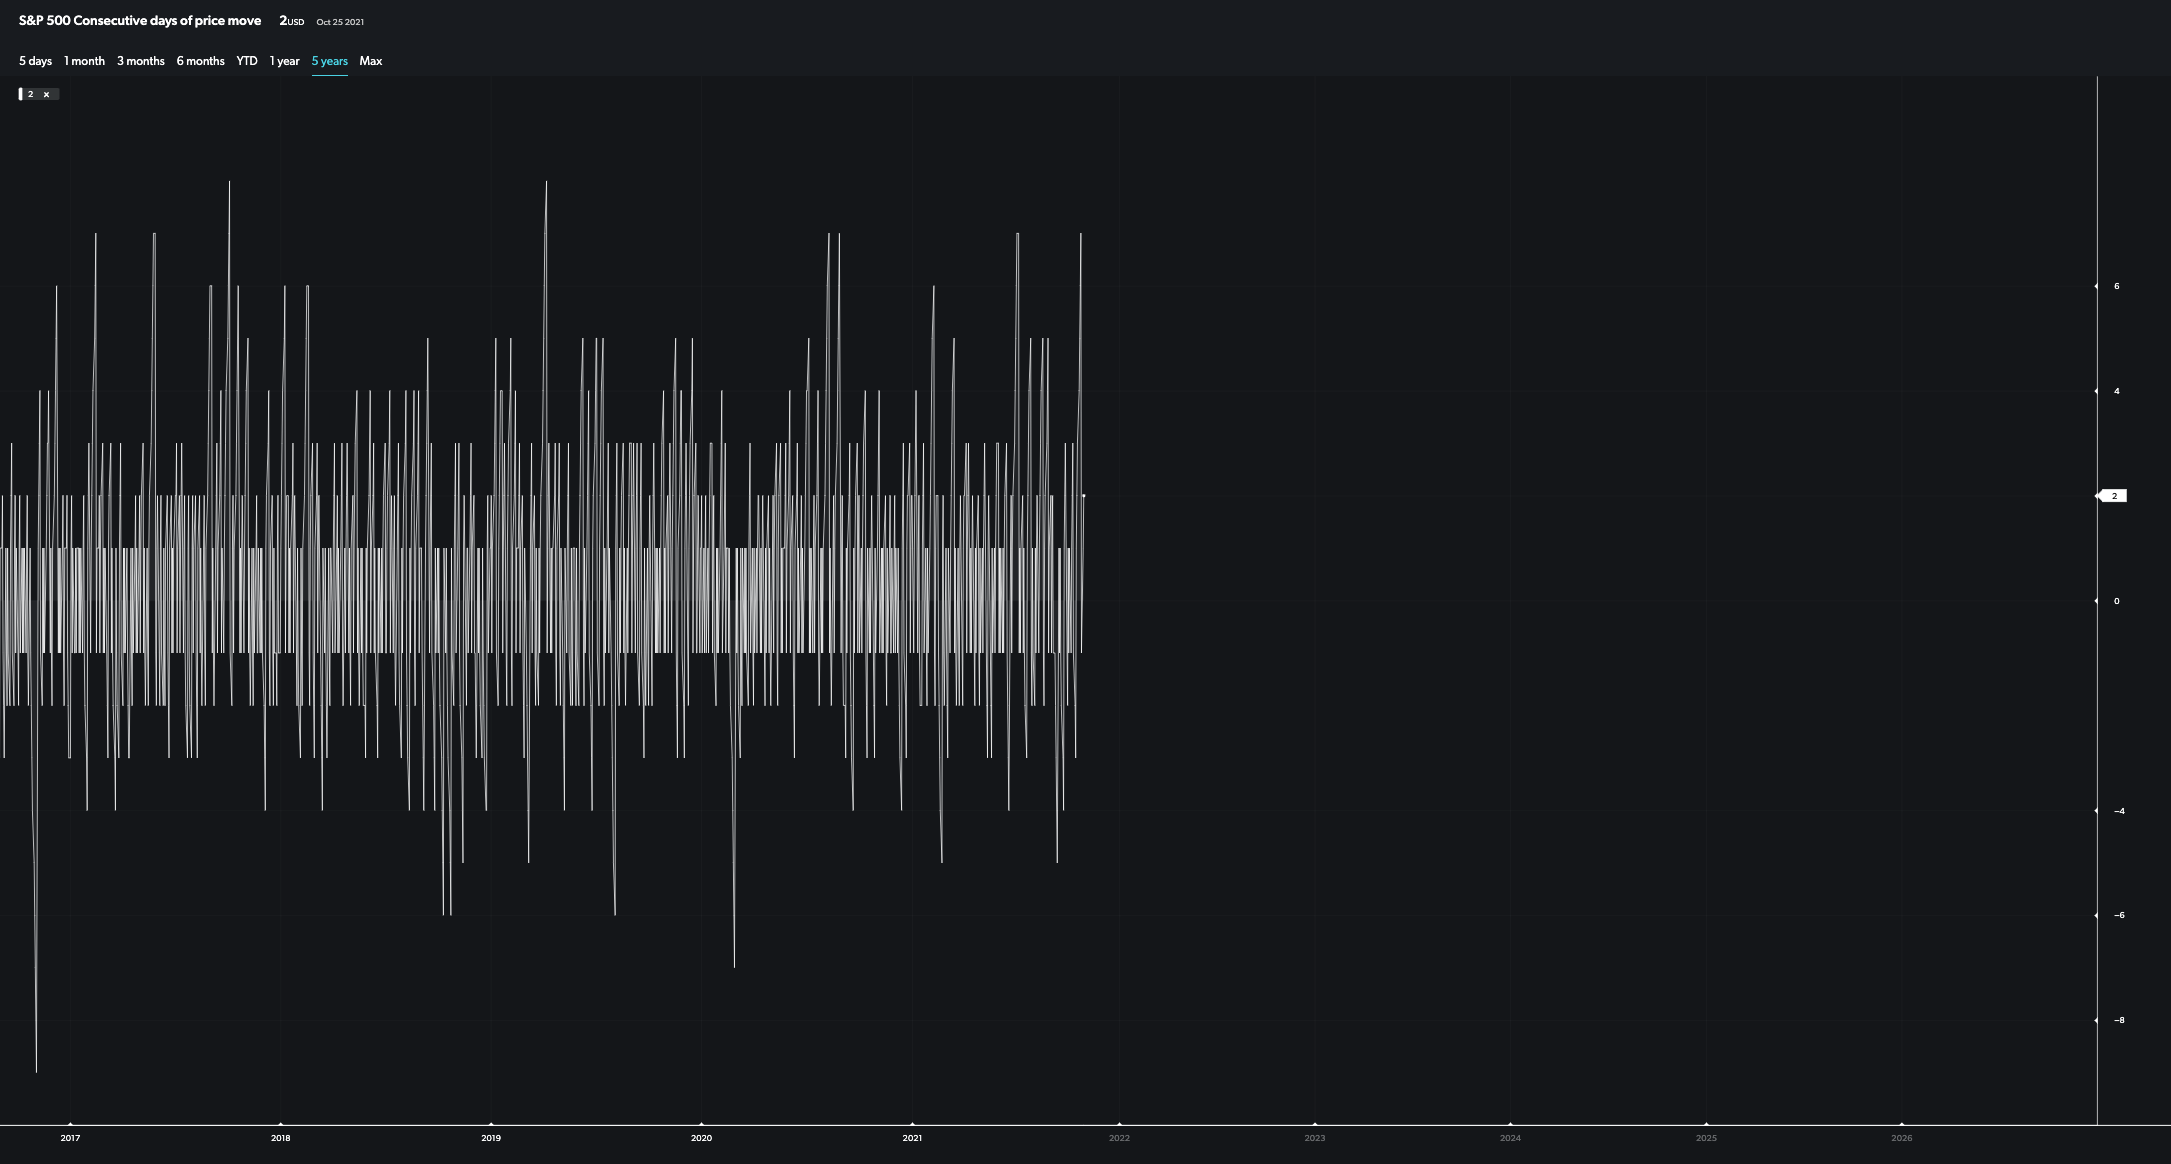
Consecutive Days Move Counter Indicator


