Support & Resistance Levels
Wish you knew where asset prices could go next? This form of technical analysis looks at where the forces of supply and demand meet, helping traders determine where prices could go next.
Toggle AI is now Reflexivity! Click here to go to our new website
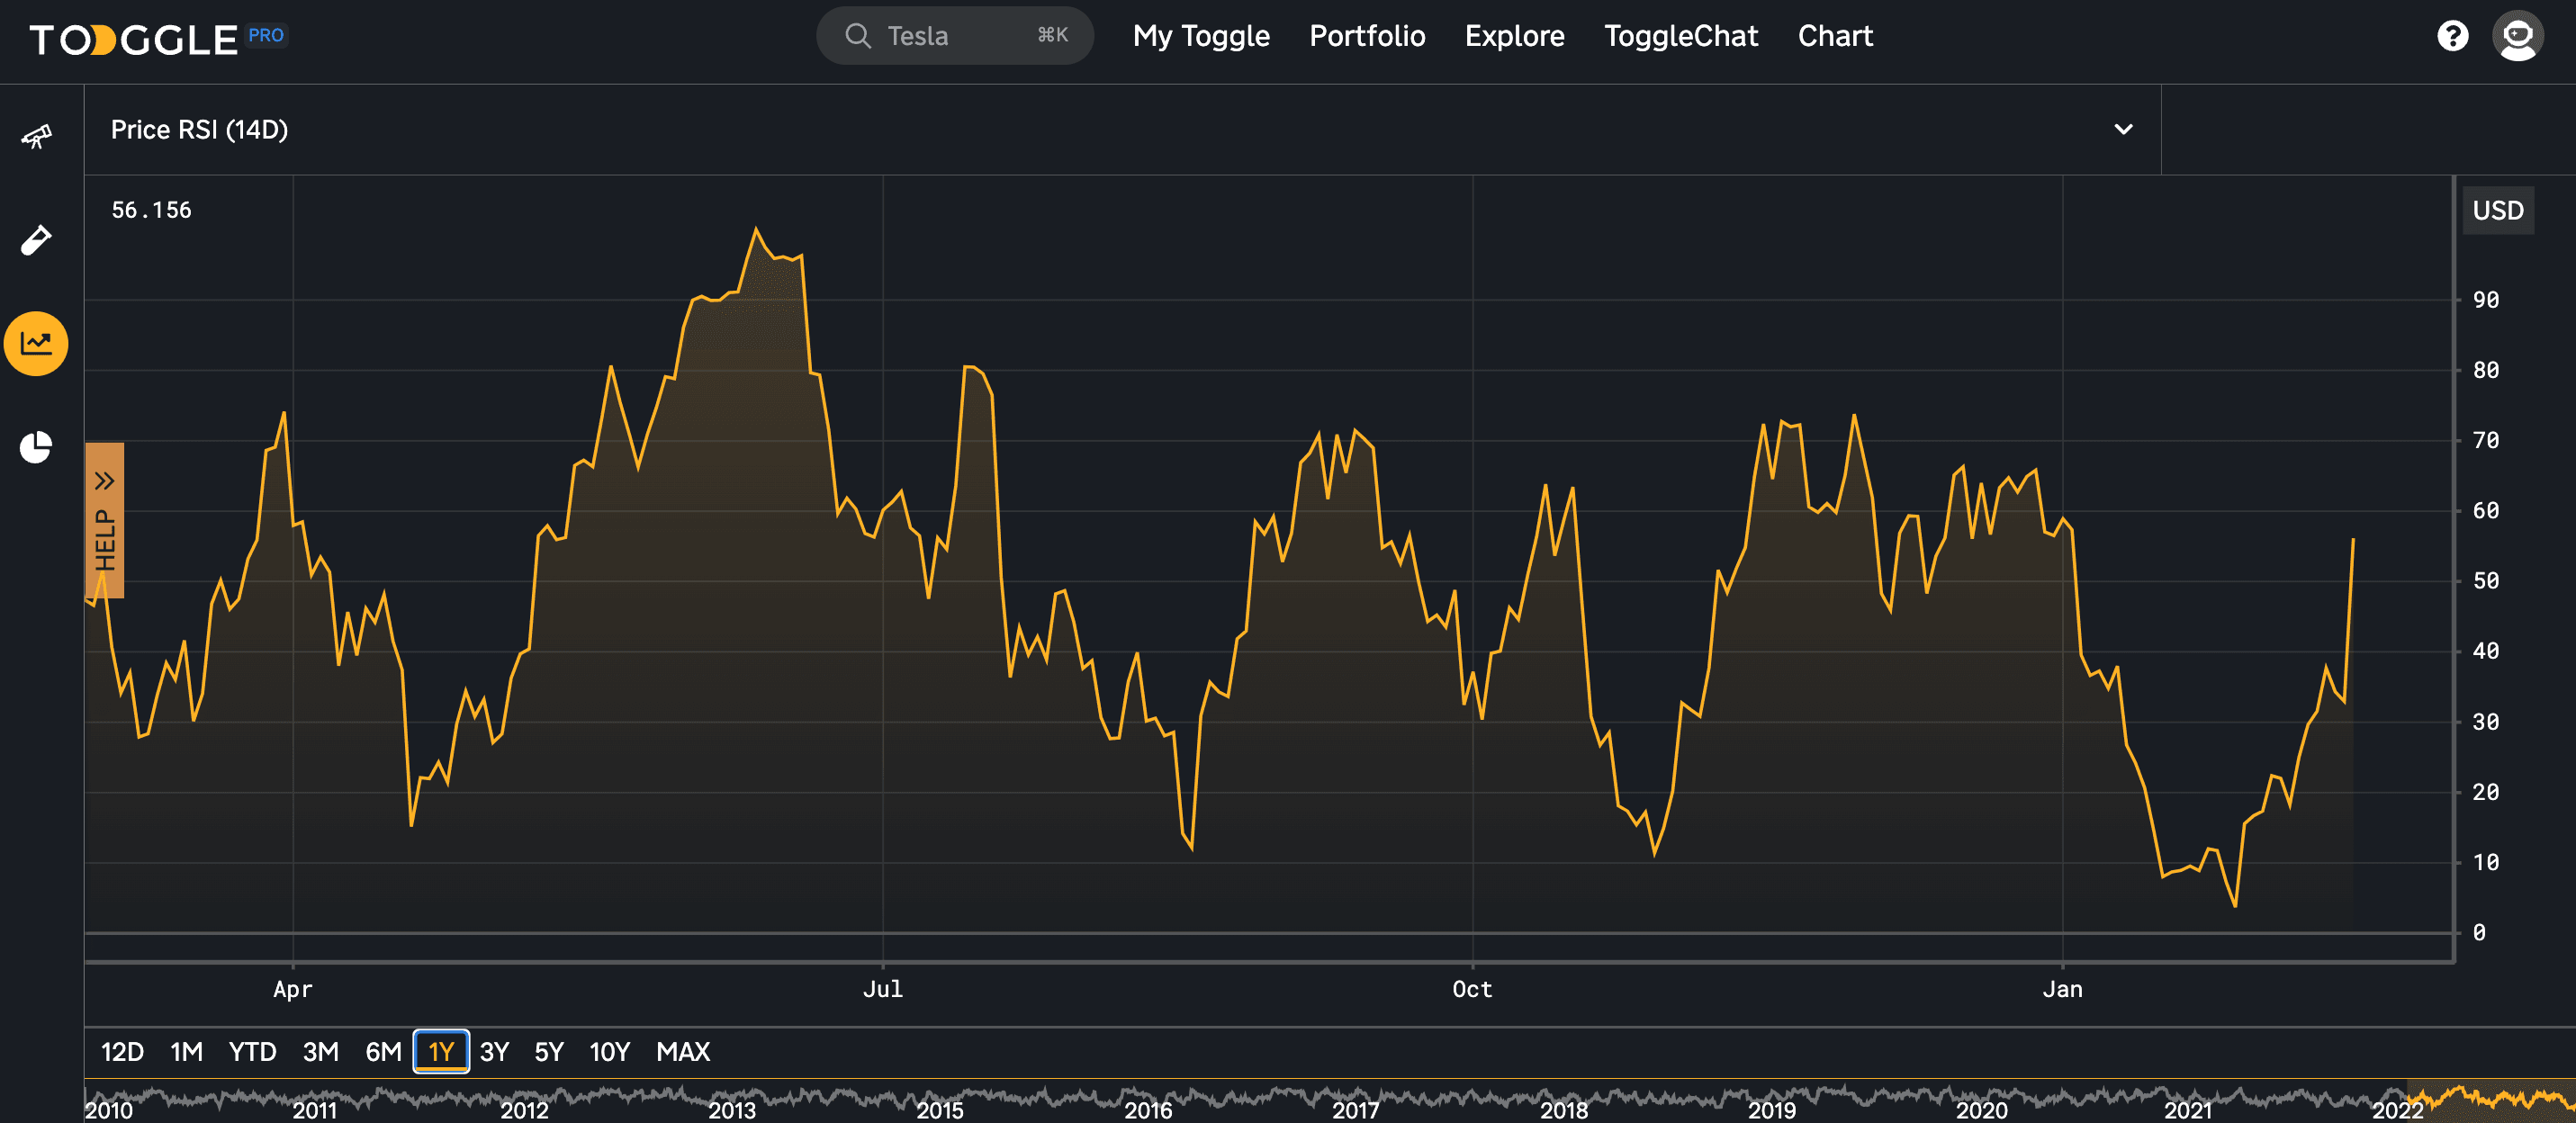
RSI is a momentum-drive oscillator that is used in technical analysis to evaluate whether an asset is overbought or oversold.
RSI moves between two values - 0 to 100, typically measured over a 14-day period. Values of 70 or above traditionally indicate that a security is overbought and may face a correction in the price. On the other hand, an RSI of 30 or below indicates an oversold asset with potential for a rise in the price.
The relative strength index was developed in 1987 by J. Welles Wilder Jr. to provide technical traders with signals about bullish or bearish price momentum. The RSI can typically be found plotted beneath the graph of an asset’s price.
How does the indicator work?
Traditionally, an asset with an RSI greater than 70 is considered overbought and less than 30 is considered oversold. However, these traditional levels can be adjusted to better fit an asset.
For example, if an asset’s RSI is repeatedly touching 70, then you might have to adjust the “overbought” level to 80. Additionally, during times of strong trends, the RSI may remain in an overbought or oversold area for an extended period of time.
Similar to prices, the relative strength index also has support and resistance levels. In a bull market, the RSI of assets tend to remain in the 40-90 range and 40-50 acts as a supporting level - that means if the RSI breaks that level, we could see a switch to a bear market.
During a bear market, the RSI tends to stay between the 10-60 range and 50-60 acts as a resistance level - thus if crossed, we could see the start of an uptrend.
These levels vary depending on the strength of an asset or the market’s underlying trend.
If the underlying asset’s price makes a new high or low that is not confirmed by the RSI, this signals a price reversal. For example, if the RSI makes a lower high and then follows with a downside move below a previous low, a Top Swing Failure has occurred. On the other hand, if the RSI makes a higher low and follows with an upside move above a previous low, a Bottom Swing Failure has occured.
Formula
RSI = 100 - [100 / (1 + (Average Upward Price Change/ Average Downward Price Change))]
Relative Strength Index (a.k.a. RSI)


