TLI - Deeper Investigation
Investigating the hit rate, forward correlation, frequency and the number of TLI alerts generated from January 2021 to June 2022
Toggle AI is now Reflexivity! Click here to go to our new website
Last updated August 22 2023
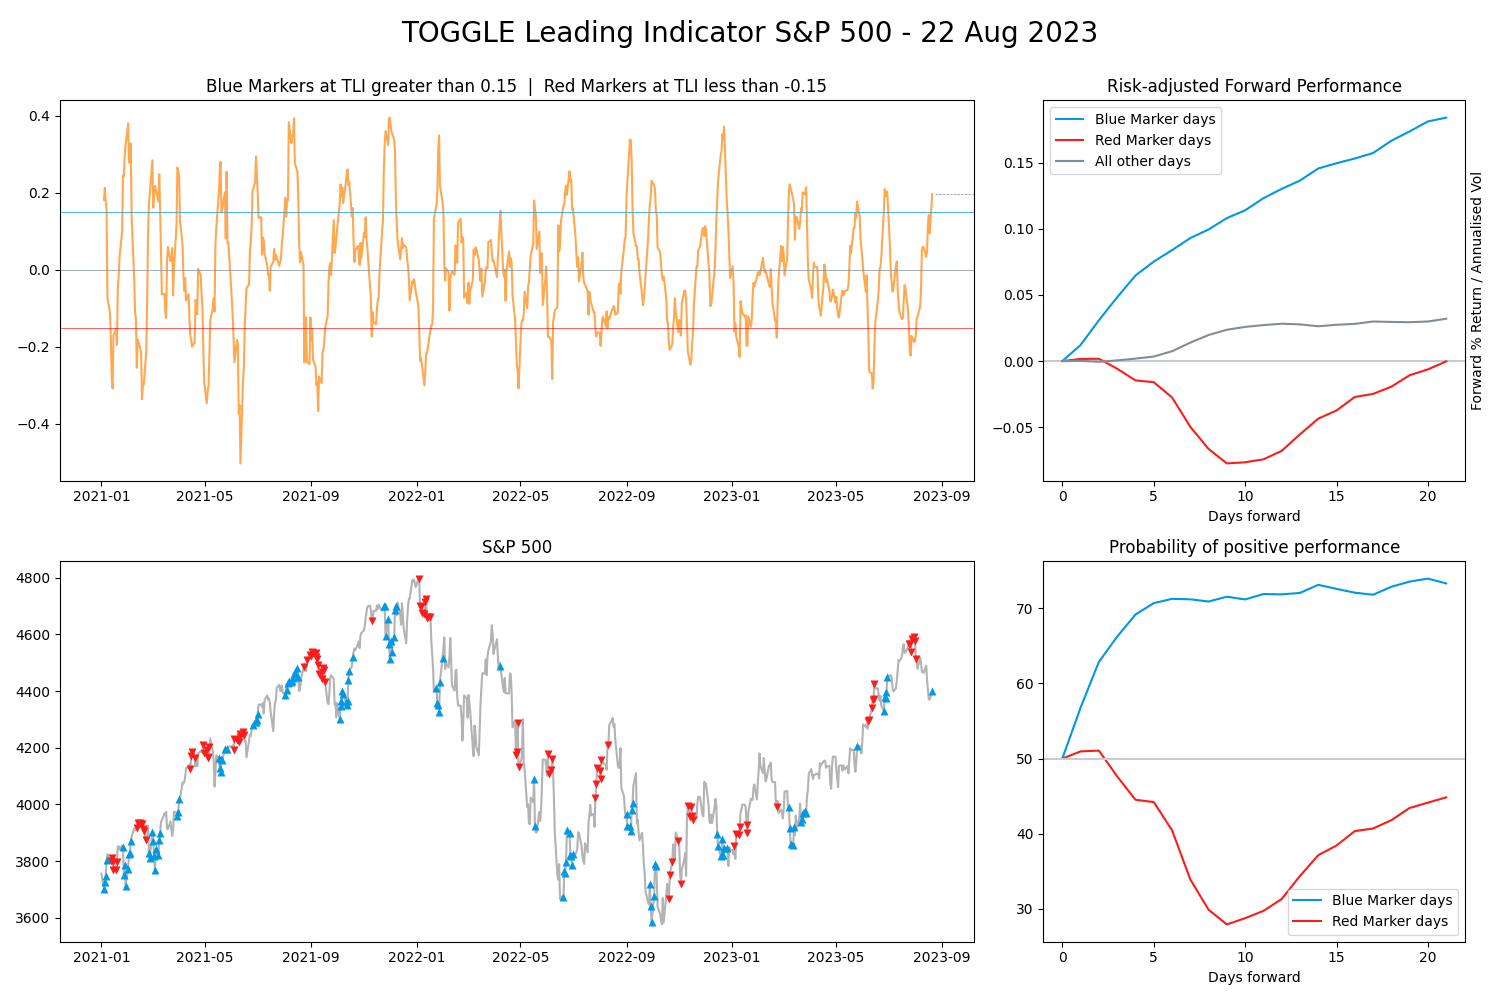
The TOGGLE Leading Indicator is an aggregated measure of all insights produced by TOGGLE on 5,000 US stocks.
When TOGGLE produces more bullish insights, pressures on the aggregate market are to the upside. And vice versa of course.
When the indicator rallies above 0.15 or falls below -0.15, the chance of seeing upside or downside moves in the broad market respectively becomes statistically higher.
Where can I find the TLI?
The TLI is updated daily on the MY TOGGLE page and TOGGLE Pro members get a special daily newsletter highlighting all the indicators we generate.
Explanation of the charts
The chart below shows the performance of the S&P 500, overlaid with instances when the TLI has hit a bullish and bearish threshold.

As you can see, the market has moved almost accurately against the TLI signals - red downward arrows for when the TLI crossed below -0.15 and blue upward arrows for when the TLI crossed above 0.15.
However, rallies and sell offs can be extended by real time information. For example, a bullish TLI accompanied by low valuation could result in an extended rally. On the other hand, a bearish TLI coupled with an upcoming FOMC could result in a steeper sell off. Furthermore, in the short term, the market can even move in the opposite direction to the TLI based on the macro picture or investor sentiment.

The following 2 graphs highlight the performance of a position traded based on when the TLI hit the bullish or bearish threshold.
The 1st chart on the left shows you the historically observed return of the position, against time.
For bearish episodes, the highest return has been observed with a holding period of 10 trading days. For bullish episodes, returns tend to rise as time goes one, with the highest returns observed 20 trading days after the signal.
The 2nd chart highlights the probability of seeing the respective performance after the TLI hits a threshold.
For bearish episodes, the highest probability of performance is observed just before the 10th trading day. In bullish times, a 5 day trading horizon has historically shown sufficient probability of seeing upside.
The TOGGLE Leading Indicator


