Candle Breadth
The candle breadth indicator is another leading indicator for the SPX generated based on assessing the intraday moves across the 1,000 largest US stocks.
Toggle AI is now Reflexivity! Click here to go to our new website
Last update August 22 2023
We love leading indicators, and we know you love them too. Today we introduce our Trough Probability Index. The index is a probabilistic gauge of how close we could be to a trough in the broad market.
A trough is the lowest point of the index’s local trading range, and would suggest prices might be trending higher in the future. Don’t forget that markets can still trend lower, due to changes in fundamentals and in the newsflow.
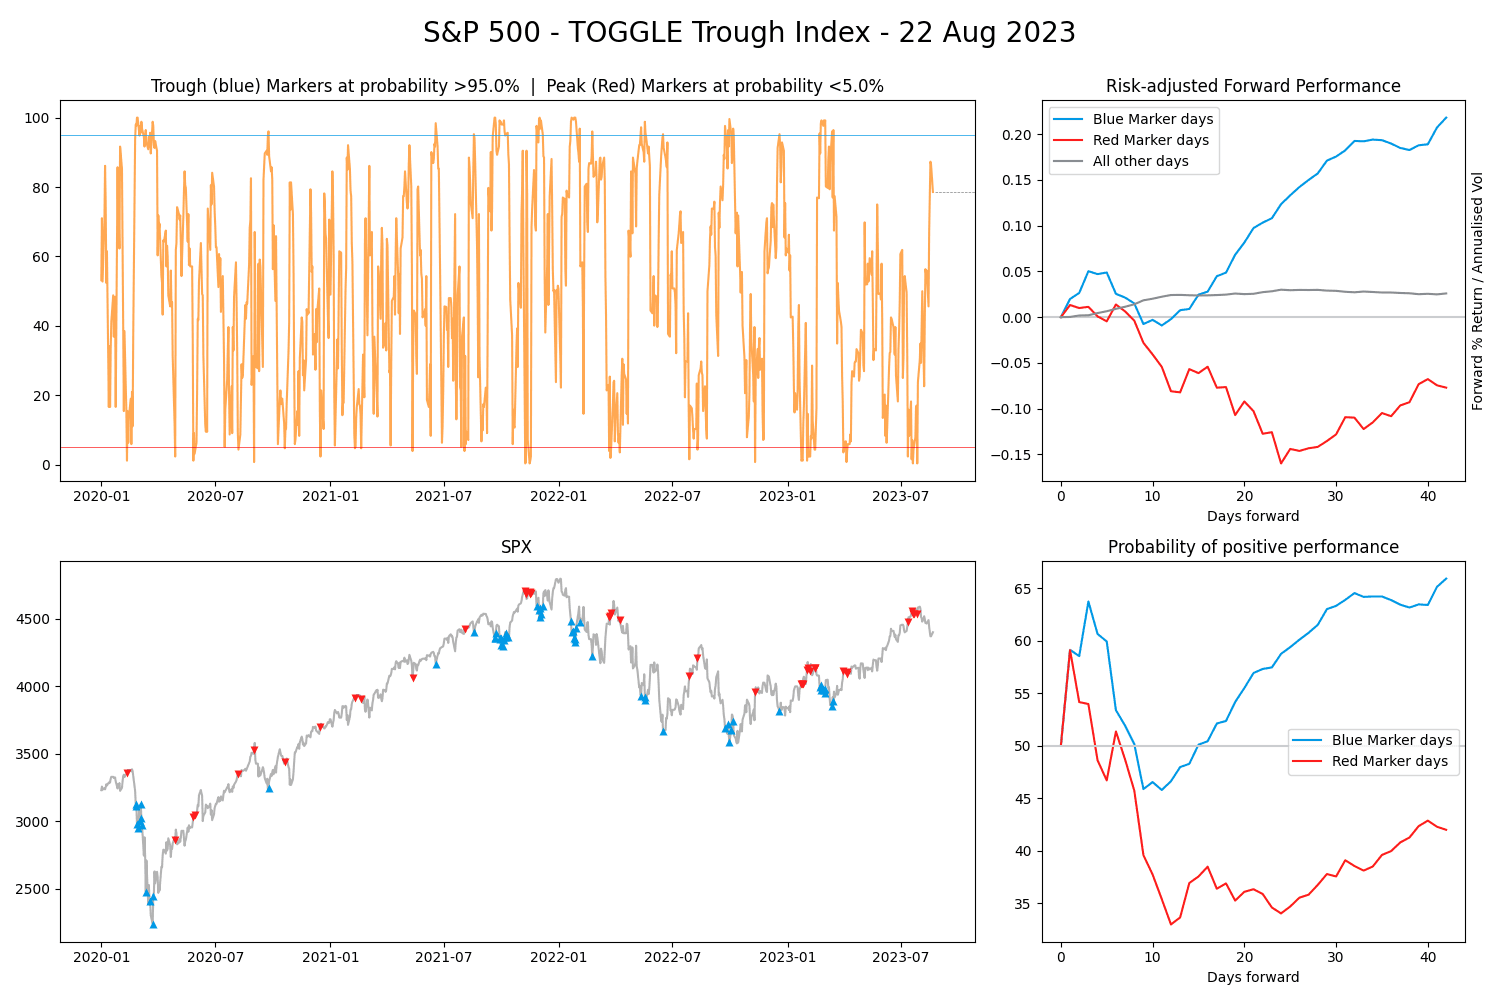
We have observed that when this indicator crosses 95, there’s a statistically meaningful chance that S&P has reached a trough and could rally in the short term. The index has shown to be most successful with an initial holding period of 5 trading days, followed by a longer period of 20 or more days.
The index is built on a risk-adjusted and time-adjusted calculation of the size of the recent market moves, and the S&P historically reacts after trending downwards for a certain period of time.
Trough Indicator


