Volume Analysis
Volume is a measure of trading activity - how many shares of a given financial asset has traded in a period of time.
Toggle AI is now Reflexivity! Click here to go to our new website
Positioning of a security to measure how many investors are in the same position for the same reason - in jargon, how “crowded” is the trade. Positioning is usually referred to with a specific focus on speculative investors that might decide to unwind their positions all at the same time.
Positioning is meant to alert you of the risk of a sharp price move against the prevalent speculative trend in a security. It shows that a lot of “impatient” money has recently been invested in a security and might decide to rush out of the trade at the first sign of adverse news. Professional investors are very interested in positioning data, because they fear to be caught in a trade along with many others who came in for the same reason - and might decide to leave all at the same time causing sharp drawdowns.
The most universally accepted measure comes from the Commodity Futures Trading Commission in the US - CFTC for short. The Commission produces a weekly report of all positions in major futures traded in US exchanges, and one thing in particular makes their reports very useful: they separate positions between “hedging” and “speculative”.
The latter part of the report allows market participants to assess how much money is long or short an asset and whether this measure changed abruptly. Here’s a nice example for ES, the ever-popular e-mini future on S&P 500.
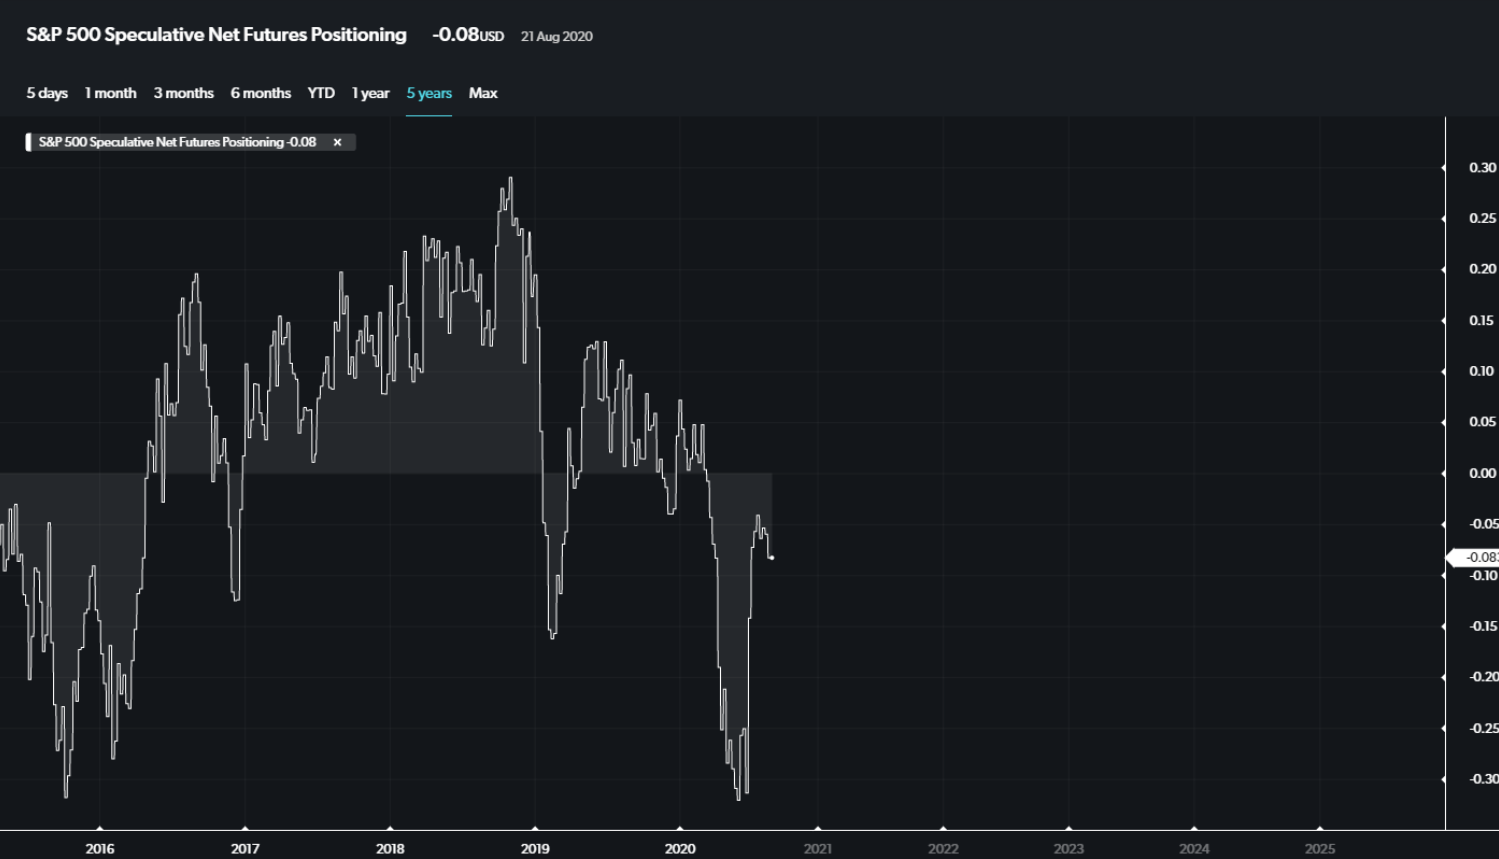
This chart is quite telling: it shows how in mid-2020 the market reached an extreme short position in the market - i.e. investors were betting hard that the market would fall.
How do I use positioning data?
The data is used to assess whether you are taking a very popular position, which might lead you to suffer when your peers unwind the position ahead of you - what’s called a “squeeze”.
Let’s look at this assuming investors believe a stock should fall. When a number of short-term investors all take in a one-sided short position in this stock, there is little selling pressure left (as they all have their desired position) and in fact some of them are even forced to trim their positions for risk-management reasons.
This means they need to buy the stock, adding upward pressure to prices which then forces other speculators to buy the stock...and this goes on until the squeeze is complete and all spec positions are “flattened” (i.e. closed).
Can you show me an example of a positioning squeeze?
The chart above about S&P 500 is a great one as it allows us to show a classic example of a “short squeeze”. Let’s add the chart of S&P 500 itself and zoom in:
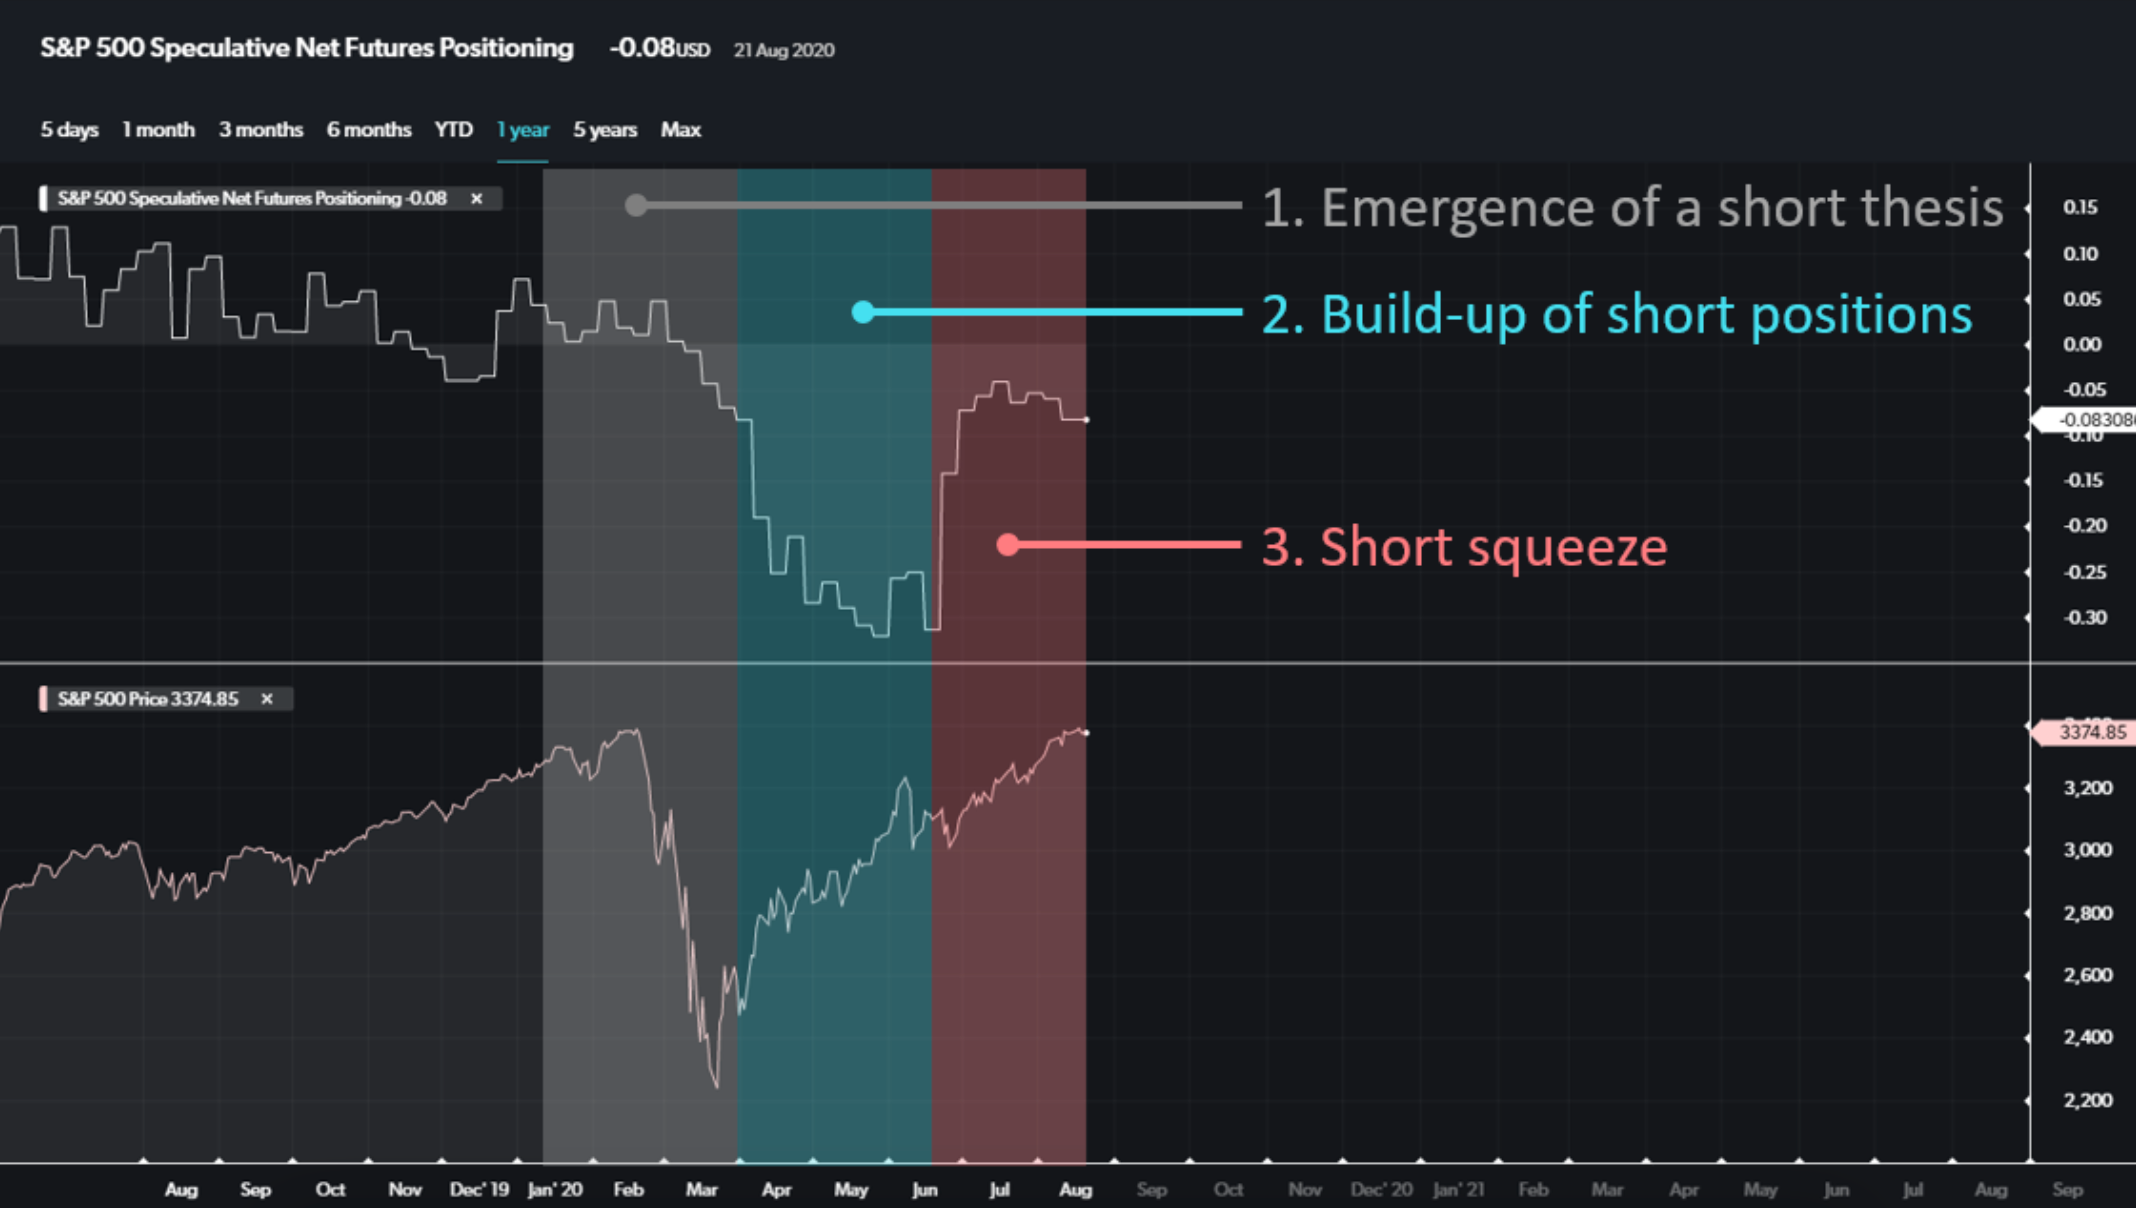
Here you can see the textbook evolution of a short squeeze.
The latter part of this chart shows how some investors choose to use positioning data: for an investor who believed that markets were overpriced and wanted to express a short position, the end of this chart (late Aug 2020) would have been in fact the ideal moment.
Without the noise generated by speculative trading, this investor’s short thesis would have had a better chance to affect the market (if the investor was right, of course). And in any case, the risk to be squeezed for this investor would have been much reduced.
This is in essence the role of positioning analysis - ensuring that deeper fundamental views can take hold of the market, once the short-term fluctuations of speculators are over.
Positioning Analysis


